Small-firm workers often face higher single deductibles than workers at larger firms, according to KFF's 2025 report on family premiums. That difference matters: employers may pay similar premiums while employees face different costs when they need care. Benchmark premiums, employer and employee contributions, and deductibles together. Then break the results down by coverage tier and salary band, since a single average can conceal which groups carry greater cost risk.
Table of Contents
- What a Benefits Benchmarking Report Actually Measures
- Why Benefits Benchmarks Matter to Your Budget
- Data Sources to Pull Benchmarks From
- How to Build Your Report Step by Step
- Reading Results Without Misleading Yourself
- A Worked Example for a 120-Person Company
- Decide on Budget and Plan Changes Next
What a Benefits Benchmarking Report Actually Measures
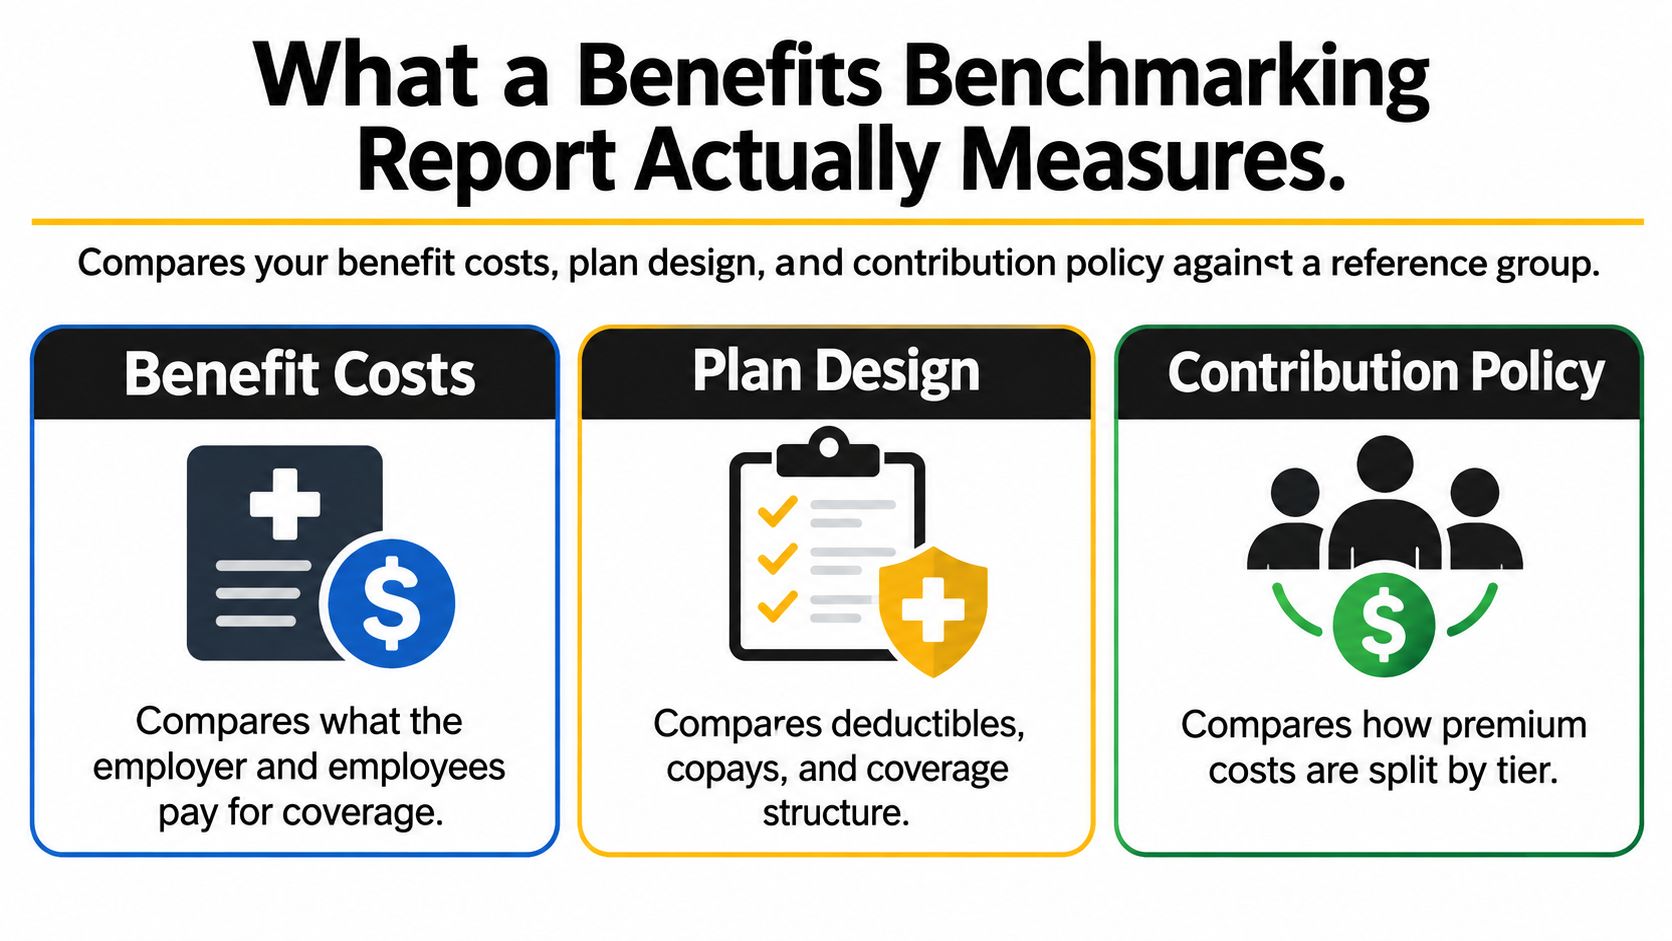
A benefits benchmarking report compares your benefit costs, plan design, and contribution policy against a reference group, such as similar sized employers in your industry and region. It shows whether your program is priced and designed like the market you hire from. It doesn't judge total spend in isolation.
The Core Inputs
Pull six inputs first. You'll need total premium, employer contribution, employee contribution, deductibles, benefits cost per employee hour, and benefits as a share of total pay. Together they separate price, who's paying, and what risk remains after the premium is paid.
That's the same discipline you apply to cash pay when you're setting defensible pay ranges. You don't compare a salary without naming the role, level, and market. Don't compare a benefits package without naming the tier, eligibility rules, and peer group either.
| Metric | How to calculate it | Reference point |
|---|---|---|
| Average family premium | Total annual premium for the family tier | $26,993 per year (KFF 2025) |
| Employer share of family premium | Total premium minus worker contribution | About $20,143 per year (KFF 2025) |
| Worker contribution, family tier | Annual payroll deduction for family coverage | $6,850 per year, about 26% of premium (KFF 2025) |
| Average single deductible | Average deductible for workers facing one in single coverage | $1,886 per year (KFF 2025) |
| Benefits cost per employee hour | Benefit spend divided by paid hours | $13.49 per hour, private industry (BLS, March 2025) |
| Benefits share of compensation | Benefit costs divided by total compensation | 29.7% for private industry (BLS, March 2025) |
| Year-over-year premium growth | Change in premium at renewal, same tier | 6% family premium increase in 2025 (KFF) |
Why the Table Is Not the Verdict
Use the table as a checklist, not a ranking. A metric only means something against a comparable group, because industry, headcount, region, and workforce mix change what normal looks like. A company above a national average may be typical for its segment, and a company below it may still lag its direct competitors.
A company wide average hides the spread between single, employee plus child, and family tiers, and between salary bands.
That's why a strong report splits every metric by tier and pay level. The average tells the CFO what the program costs. The split tells HR whether employees can afford to use it.
Why Benefits Benchmarks Matter to Your Budget
Benefits aren't a side expense. In March 2025, private industry employers spent $45.38 per hour worked on total compensation, with $31.89, or 70.3%, in wages and salaries and $13.49, or 29.7%, in benefits, according to the U.S. Bureau of Labor Statistics Employer Costs for Employee Compensation release. Nearly three tenths of compensation cost deserves the same scrutiny as payroll.
Three Decisions the Report Changes
Setting next year's budget. Renewal movement, tier mix, and eligibility determine whether last year's budget still buys the same benefit. A flat budget can be a quiet cut once premiums rise faster than pay, because either the company absorbs less cost or employees absorb more.
Defending recruiting competitiveness. Candidates compare total offers, not salary alone. Job seekers check cash pay against resources such as salary benchmarks for technology job seekers, then test whether family coverage and deductibles erase the gain. A benchmark shows where your offer wins or loses.
Choosing what to change. If cost is high because contributions are rich, plan design is broad, or participation changed, each cause points to a different fix. Our guide to health insurance cost for employers can help frame those cost drivers before you model changes.
The Averages Trap
Employer type alone can distort the conclusion. The BLS release linked above reported public sector benefit costs at $24.58 per hour, compared with $13.49 in private industry. Compare a private company with a blended national average and you'll create a gap that says more about the reference group than your management.
An executive should expect three answers from the report. What do we spend per employee? How does that compare with a segmented peer group? Which decision, contribution, plan design, or eligibility would change the spend? If the report can't answer all three, it's a price list, not a budget tool.
Data Sources to Pull Benchmarks From
A useful benchmark depends on matching each question to the right source. Public datasets establish context, while payroll, enrollment, and employee feedback show how your own costs and coverage differ. Keep the comparison segmented by coverage tier and, where records allow, salary band. One average premium can conceal whether family coverage or lower-paid employees carry the greater cost burden.
| Source | What it covers | Best use in the report |
|---|---|---|
| BLS Employer Costs for Employee Compensation | Hourly total compensation and benefit costs by employer type | Benefits share of payroll and cost per employee hour |
| KFF Employer Health Benefits Survey | Premiums, employer and worker contributions, deductibles | Premium and contribution benchmarks by tier |
| IRS ACA affordability guidance | Annual affordability percentage of household income | Testing whether employee contributions pass the affordability test |
| IFEBP Employee Benefits Survey | Preventive care and cost control practices across industries | Plan design peer comparison |
| Gallagher Benefits Benchmarks | Premium increases reported at renewal across employers | Year-over-year cost trend comparison |
| Your payroll and enrollment records | Headcount, tier mix, eligibility, premiums actually paid | Your side of every comparison |
Reading Each Source Correctly
BLS figures describe compensation structure, not the price of your specific plan. Use KFF for premium, contribution, and deductible comparisons by tier. Industry surveys can show how employers approach practices such as preventive care promotion or prior authorization. Renewal reports help distinguish a market-wide increase from changes tied to your claims or plan mix.
For every figure, record its publisher and release date. Comparing a premium from one year with a deductible or compensation figure from another period can distort the result unless the time periods are clear.
Cost files also leave out employee experience. A workforce survey can reveal whether employees avoid a low-premium plan because its deductible feels out of reach. A structured employee benefits survey template can help HR teams collect that feedback alongside enrollment and claims data. Comparing responses by salary band and coverage tier can show whether the same plan design creates different affordability pressures across the workforce.
The IRS Test Readers Misapply
Under the Affordable Care Act premium tax credit rules, employer coverage is generally considered affordable when the employee's required contribution for self only coverage under a minimum value plan does not exceed the adjusted percentage of household income. The IRS premium tax credit guidance lists the threshold as 9.02% for 2025 and 9.96% for 2026.
Practical rule: Test the lowest cost qualifying option that provides minimum value, not the average contribution across all your plans.
Averaging a rich plan with a lean one can misstate the affordability result. Show the qualifying plan, the employee's required self only contribution, and the threshold for the applicable year together. For budget analysis, keep that compliance test distinct from broader comparisons by tier and salary band, which can expose employee cost pressure that the IRS calculation does not measure.
How to Build Your Report Step by Step
Build the report so someone else can repeat it next year and get a comparable answer. Method matters as much as the result, because undocumented choices turn a trend into an argument.
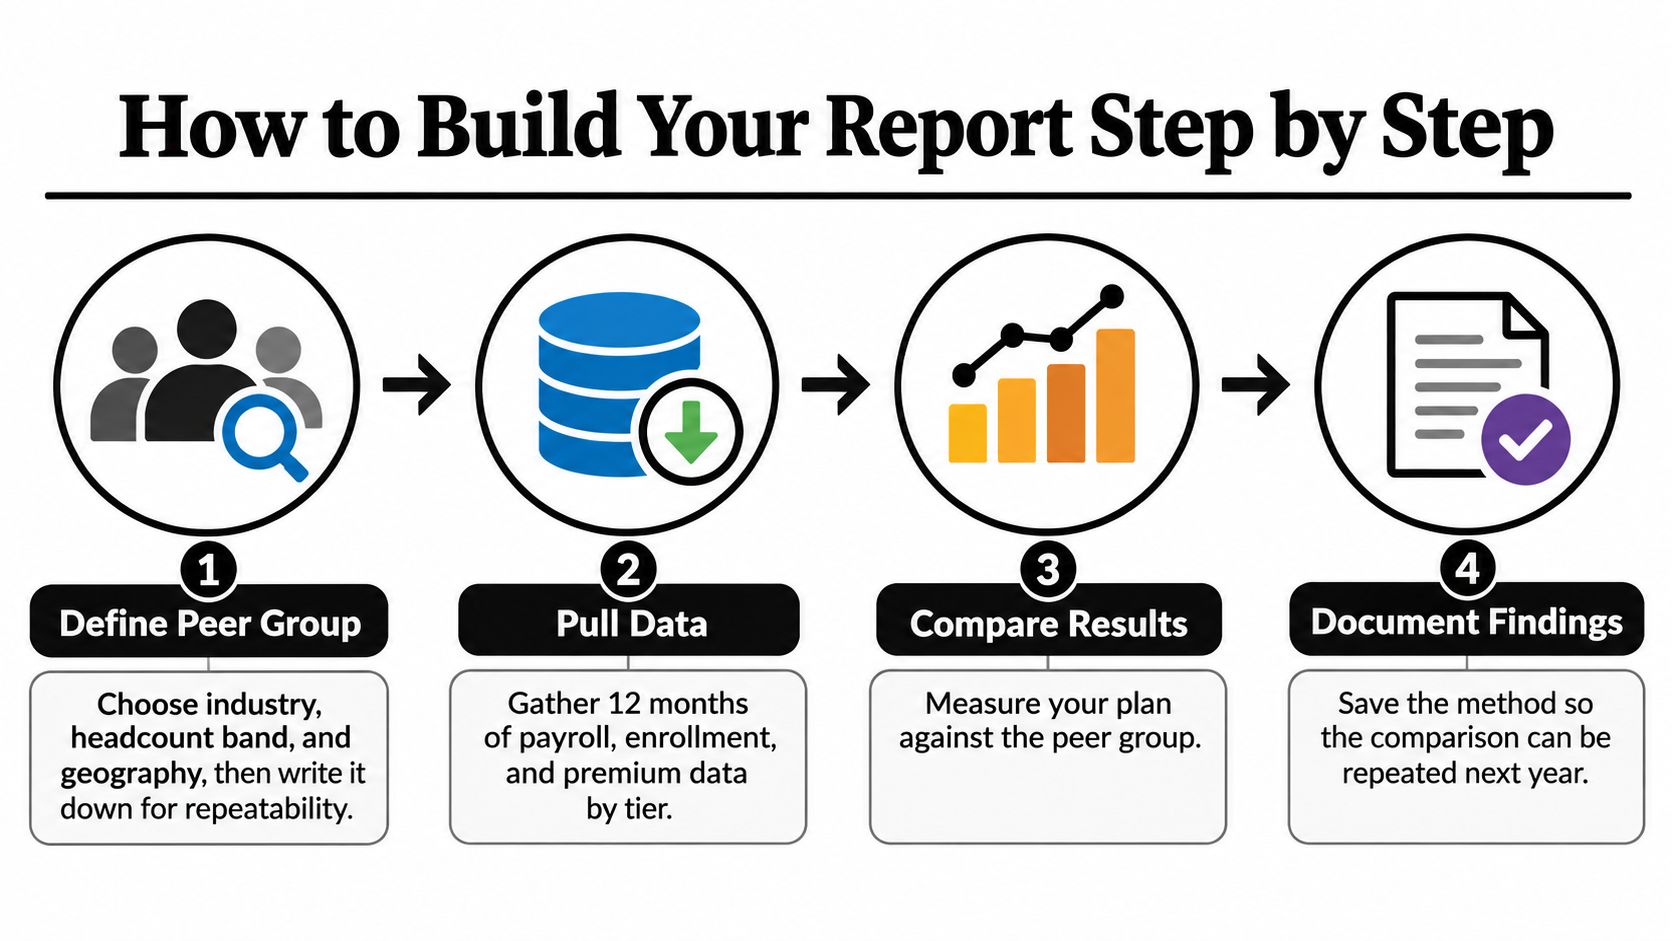
Steps One to Four
- Define the peer group. Choose industry, headcount band, and geography, then write the definition on page one. A named peer group prevents cherry picking a flattering average later.
- Pull 12 months of data. Gather payroll, enrollment, and premium records by tier rather than taking a single snapshot. Twelve months captures midyear hires, terminations, tier changes, and rate changes.
- Calculate cost per enrolled employee. Separate the employer share from the employee share for each tier. A blended cost per employee hides whether family enrollment or single enrollment drives spend.
- Calculate benefits as a share of total compensation. In December 2025, private industry employers spent $13.79 per employee hour on benefits, representing 29.9% of total compensation, according to the Bureau of Labor Statistics December 2025 release. State which release you used, because hourly figures change.
Steps Five to Eight
- Compare within the same segment. Match each metric to employers with similar industry, workforce size, geography, and eligibility. This prevents a higher cost workforce or unusually broad eligibility from being labeled inefficient.
- Test affordability. Apply the threshold for the relevant year to the lowest cost qualifying plan. Record the contribution tested, not just a pass or fail label.
- Calculate year over year change. Track premiums, contributions, and deductibles across at least three years. The BLS release linked above reported employer benefit costs increased 3.4% year over year through December 2025, so a flat budget may buy less even when headcount doesn't change.
- Assemble a repeatable template. Include scope and peer group, data sources, the metrics table, gaps by tier and salary band, and recommended actions with owners and dates.
Normalize costs in two ways, per enrolled employee and as a share of total compensation. Annual premium spend alone rewards companies with low participation and penalizes companies that enroll more families. The dual view lets you test whether savings came from plan design, contribution policy, or people dropping coverage.
Save the workbook, definitions, and source dates with the report. Next year's value comes from consistency, and consistency is impossible if the method lives only in one analyst's memory.
Reading Results Without Misleading Yourself
Premiums, employer contributions, worker contributions, and deductibles describe different parts of the same cost. Average annual premiums were $9,325 for single coverage and $26,993 for family coverage, based on responses from 1,862 randomly selected nonfederal public and private employers with at least 10 workers in the 2025 KFF Employer Health Benefits Survey. Employees paid $1,440 toward single coverage and $6,850 toward family coverage, about 15% and 25% of total premiums, respectively.
Show both employer and worker shares. Reporting only the employer-paid portion hides what employees must contribute to enroll. Reporting only payroll deductions understates the company's investment in compensation. A useful comparison shows each contribution in dollars and as a share of the premium, then separates results by coverage tier and salary band. An average can conceal a meaningful affordability problem for one group.
Tier and Salary Band Gaps
A uniform dollar subsidy creates different burdens across tiers. The same employer contribution covers a larger share of a single premium than a family premium, leaving family enrollees to pay more. The impact on lower-paid employees can be greater when deductions consume a larger share of earnings. A percentage-based contribution keeps the employer share more consistent, though family costs still rise in dollars as premiums increase.
Compare contribution designs before changing them. For each tier and salary band, estimate employer spending, employee payroll deductions, and how the resulting offer compares with market references. This is the kind of scenario analysis Financial Analysts use to test assumptions rather than rely on one company-wide average. Benely's Evaluate process includes contribution analysis and side-by-side market comparisons.
Benchmark HSA-qualified high-deductible plans separately from traditional designs. Employer HSA contributions affect employees' net exposure, so comparing deductibles alone can make one plan look more or less costly than it feels to the people enrolled. Include the employer contribution when assessing the plan, and consider both the premium employees pay to enroll and their potential cost when using care.
| What you see | Likely cause | Action |
|---|---|---|
| Premium below market, but high deductibles | Risk shifted to employees through plan design | Measure deductible burden as a percent of pay before calling the plan competitive |
| Employer cost per employee above peer median | Richer contribution policy or broad eligibility | Model contribution changes by tier and salary band |
| Family tier unaffordable for lower paid staff | Flat dollar contribution across salary bands | Compare family tier burden as a percent of pay |
| Flat budget with rising premiums | Loss of purchasing power | Re-baseline the budget at renewal |
| Low enrollment in one tier | Premium gap too wide for that group | Check tier pricing and eligibility rules |
| Strong results in one year only | One-time claims or single-year noise | Compare at least three years before changing plans |
The Small Firm Exposure
A market-level premium comparison does not establish that coverage is affordable for a particular workforce. Deductibles and other out-of-pocket costs can leave employees exposed even when premiums appear competitive. Compare premium and deductible burdens as a percentage of pay across salary bands, and include the out-of-pocket maximum to show potential annual exposure. This reveals whether a plan's apparent savings come with costs concentrated among lower-paid employees or family enrollees.
Don't call a plan affordable until you've tested what an employee pays to enroll and what that same employee pays to use care.
A Worked Example for a 120-Person Company
A single average premium can conceal who carries the cost. For a hypothetical 120-person company in one region, compare employer and employee contributions by coverage tier, then calculate each employee contribution as a share of pay within salary bands. The figures below are illustrative, not a client result.

The KFF Employer Health Benefits Survey series reports an average family coverage premium of $26,993 in 2025, up 6%, or $1,408. Workers paid $6,850 annually toward family premiums, leaving employers about $20,143. These averages provide a comparison point, but they do not show how the deduction affects employees at different pay levels.
One Worker and One Calculation
Suppose an employee earns $52,000 and enrolls in family coverage. A $6,850 annual contribution is 13.2% of pay ($6,850 divided by $52,000). That ratio helps assess workforce affordability, especially when compared with the same calculation across salary bands.
The ACA affordability test requires a different input: the employee's self-only contribution for the lowest-cost plan that qualifies as minimum value, measured against the applicable threshold for the correct year. The average self-only contribution of $1,440 cannot establish whether this employee passes or fails the test. It is an average, not necessarily the contribution for the qualifying plan offered to this worker.
| Item | Amount |
|---|---|
| Average family premium, total | $26,993 |
| Employer share, family tier | $20,143 |
| Worker family contribution | $6,850 |
| Worker self-only contribution | $1,440 |
| IRS affordability threshold, 2026 | 9.96% |
In this illustration, the family contribution sits near the company's peer median. That comparison alone can obscure cost risk: employees in lower salary bands may spend a larger share of pay on the same family deduction. Plot family contributions as a percentage of pay by salary band, using the same tier and inputs. The chart shows which groups bear the greatest burden, while the premium average shows only the overall cost level.
The video below explains how contribution choices affect employees across coverage tiers.
A targeted adjustment can preserve the overall contribution structure while adding a percentage-based contribution for lower salary bands. Rerun the comparison at renewal, checking the employee burden by tier and salary band alongside total employer spending. A lower average premium is not sufficient evidence of improvement if the highest-burden group still pays the largest share of its income.
Decide on Budget and Plan Changes Next
A benchmark should end in decisions, not observations. You may adjust next year's benefits budget, change contributions by tier, revisit deductibles that shift risk to employees, add a wellness program where utilization shows a gap, or evaluate a PEO if co employment would better align coverage, costs, and compliance.

Check four items before you act.
- Peer group confirmed: Industry, headcount band, and geography are written down.
- Affordability confirmed: The test uses the lowest cost qualifying plan and the correct year.
- Trend confirmed: At least three years support the change.
- Ownership confirmed: Each action has an owner and a date.
Use our resource to compare health insurance plans once your internal review identifies the gap, then pressure test any vendor proposal against the same peer group and salary band calculations. In our Evaluate step, we compare current insurance plans with other market options to find cost effective solutions. You can also rate your benefits process through our free benefits score and receive a free 30 page benefits guide. Treat that as one practical starting point, paired with your own benchmark review before any vendor conversation.
Turn your benchmarking report into a budget decision by testing premiums, contributions, and deductible burden by tier and salary band. Benely helps you compare your current plans with market options, rate your benefits process, and build a contribution strategy your employees can afford to use. Visit Benely to get your free benefits score and start your evaluation.