

Benefits account for 29.8% of total compensation at U.S. private-industry employers, not just the health insurance premium, according to the Bureau of Labor Statistics' June 2025 employer compensation data. That distinction changes how you should budget: medical coverage is only part of what it costs to employ someone.
A useful small business employee benefits cost estimate needs two views. The employer needs a fully loaded compensation budget, while employees need to know what coverage could cost them when someone gets seriously ill. For 2026 planning, use the historical benchmarks below as reference points, then replace averages with renewal quotes, actual enrollment and your contribution policy.
Table of Contents
- Average Small Business Benefits Cost Benchmarks
- Line Items That Drive Benefits Cost
- How to Estimate Cost per Employee Step by Step
- What Employees Really Pay in a Bad Year
- How Company Size and Funding Model Change Costs
- Tax Credits and Compliance Costs That Change the Math
- Cut Costs Without Cutting Coverage
- Set Your Budget Before You Choose a Provider
Average Small Business Benefits Cost Benchmarks
Benefits cost benchmarks for 2025 and 2026 planning
| Benchmark | Value | Source and note |
|---|---|---|
| Benefits share of total compensation | 29.8% | BLS, June 2025, private industry |
| Benefits cost per employee hour | $13.58 | BLS, June 2025, alongside wages of $32.07 per hour |
| Implied benefits cost per full-time equivalent | About $28,246 per year | $13.58 × 2,080 hours, broad benchmark only |
| Average total annual premium, single coverage | $9,325 | KFF 2025 Employer Health Benefits Survey |
| Average total annual premium, family coverage | $26,993 | KFF 2025 Employer Health Benefits Survey |
| Employee share of premium, single and family | 16% and 26% | KFF 2025 Employer Health Benefits Survey |
The BLS figures above describe private industry broadly, while the health premium and contribution figures come from the KFF 2025 Employer Health Benefits Survey. That survey also found that 41% of small firms not offering health benefits identified insurance cost as their most important reason.
These measures answer different questions. The compensation benchmark helps you check whether your labor budget includes benefits beyond insurance; the premium benchmarks help you evaluate medical coverage proposals.
Read the denominator before setting a budget
Benefits as a share of total compensation isn't the same as benefits as a percentage of payroll. Total compensation includes wages and benefits, while a payroll-based benefits load typically divides benefits expense by wages alone.
Use this formula consistently:
Benefits load = annual employer benefits expense ÷ annual wages and salaries. Label the denominator on every budget report so finance and HR aren't comparing different measures.
The annualized BLS figure also isn't a recommended spending target. It includes paid leave, supplemental pay, insurance, retirement and savings, and legally required programs. Your company's enrollment mix and compensation structure determine how close it should come to that broad benchmark.
A business with mostly employee-only enrollment shouldn't expect the same medical expense as one with substantial family enrollment. Likewise, a company that already records paid leave within its salary budget must avoid adding the same expense again when building a benefits total.
Separate planning context from a purchasing decision
National averages don't tell you whether a particular carrier proposal is competitive. For that decision, compare quotes using the same employee census, coverage tiers, contribution assumptions and effective date.
Keep these budget categories separate:
- Employer-paid coverage: Medical, dental, vision and other employer-funded insurance.
- Other compensation benefits: Retirement contributions, paid leave and supplemental pay.
- Statutory and operating costs: Required employer programs, administration and outside service fees.
Before setting a hiring budget, calculate your own benefits load from the general ledger and payroll records. Then identify which expenses increase with each hire, which increase only when someone enrolls, and which remain relatively fixed.
Line Items That Drive Benefits Cost
A benefits budget is a collection of different financial commitments. Some are insurance premiums, some depend on employee participation, and others follow payroll or legal requirements. Treating them as one undifferentiated percentage makes it harder to find a useful savings lever.
Benefit line items, cost drivers and levers
| Line item | Main cost driver | Who usually pays | Main lever |
|---|---|---|---|
| Medical | Premium tier, deductible, network and plan design | Shared between employer and employee | Plan design and funding model |
| Dental | Coverage tier and annual maximum | Often shared, according to employer policy | Coverage level and annual maximum |
| Vision | Exam frequency and lens allowances | Often shared, according to employer policy | Add-on or separate carrier |
| Retirement match, including 401(k) | Match formula, participation and vesting schedule | Employer | Match formula and vesting |
| FSA and HSA | Employer contribution rules and administration fees | Employer and employee | Contribution rules and administration fee |
| Life and disability insurance | Benefit amount per salary dollar | Usually employer for base coverage | Coverage amount and group rate |
| Statutory payroll costs | Social Security, Medicare, unemployment insurance and workers' compensation | Employer for employer obligations | Apply required rules and track separately |
The BLS employer compensation release for March 2025 distinguishes insurance, paid leave, retirement and savings, supplemental pay, and legally required benefits. That classification provides a useful accounting structure even when your internal budget uses more detailed subcategories.
Review the controllable commitments first
Start with medical because it combines substantial expense with several design decisions. Ask the broker to separate the effect of changing carriers from the effect of changing the deductible, network or employer subsidy. Otherwise, you won't know whether a cheaper proposal reflects better pricing or less coverage.
Dental and vision deserve their own comparisons. Check annual maximums, covered services, exam frequency, frame or lens allowances, and participating providers rather than assuming a bundled proposal is automatically better.
For retirement, model the match formula against actual employee participation and compensation. Vesting affects employees' ownership of employer contributions and potential forfeitures, but it doesn't necessarily reduce the cash you must contribute immediately.
Account funding also needs a separate line. Our HSA guidance for employers can help frame the decision, but the budget should distinguish employer deposits, employee deductions and administration charges. Don't treat employee-funded account contributions as employer expense.
Keep required costs and special workforce obligations visible
Statutory obligations aren't discretionary benefits that you can remove at renewal. Although legal contribution requirements aren't negotiable, some insurance-related expenses, including workers' compensation, still require attention to classification, underwriting and coverage arrangements.
Seasonal hiring can add obligations outside a standard benefits comparison. For employers evaluating temporary labor programs, Contigo Labor Solutions' guide to employer obligations for seasonal worker housing provides a separate planning reference. Keep those workforce expenses distinct from health premiums.
Our listed benefit areas include Medical, Dental, Vision, COBRA, Systems, FSA & HSA, 401(k) and Payroll, plus more. Review medical first for pricing and design opportunities, then model the retirement match because its formula makes the employer commitment relatively straightforward to test.
How to Estimate Cost per Employee Step by Step
Build the calculation in a spreadsheet that reconciles to carrier invoices and payroll. Use separate columns for total plan cost, employer expense and employee deductions. A combined column can make a generous-looking package appear much more expensive to the employer than it is.
The process below starts with coverage and finishes with a fully loaded annual estimate.
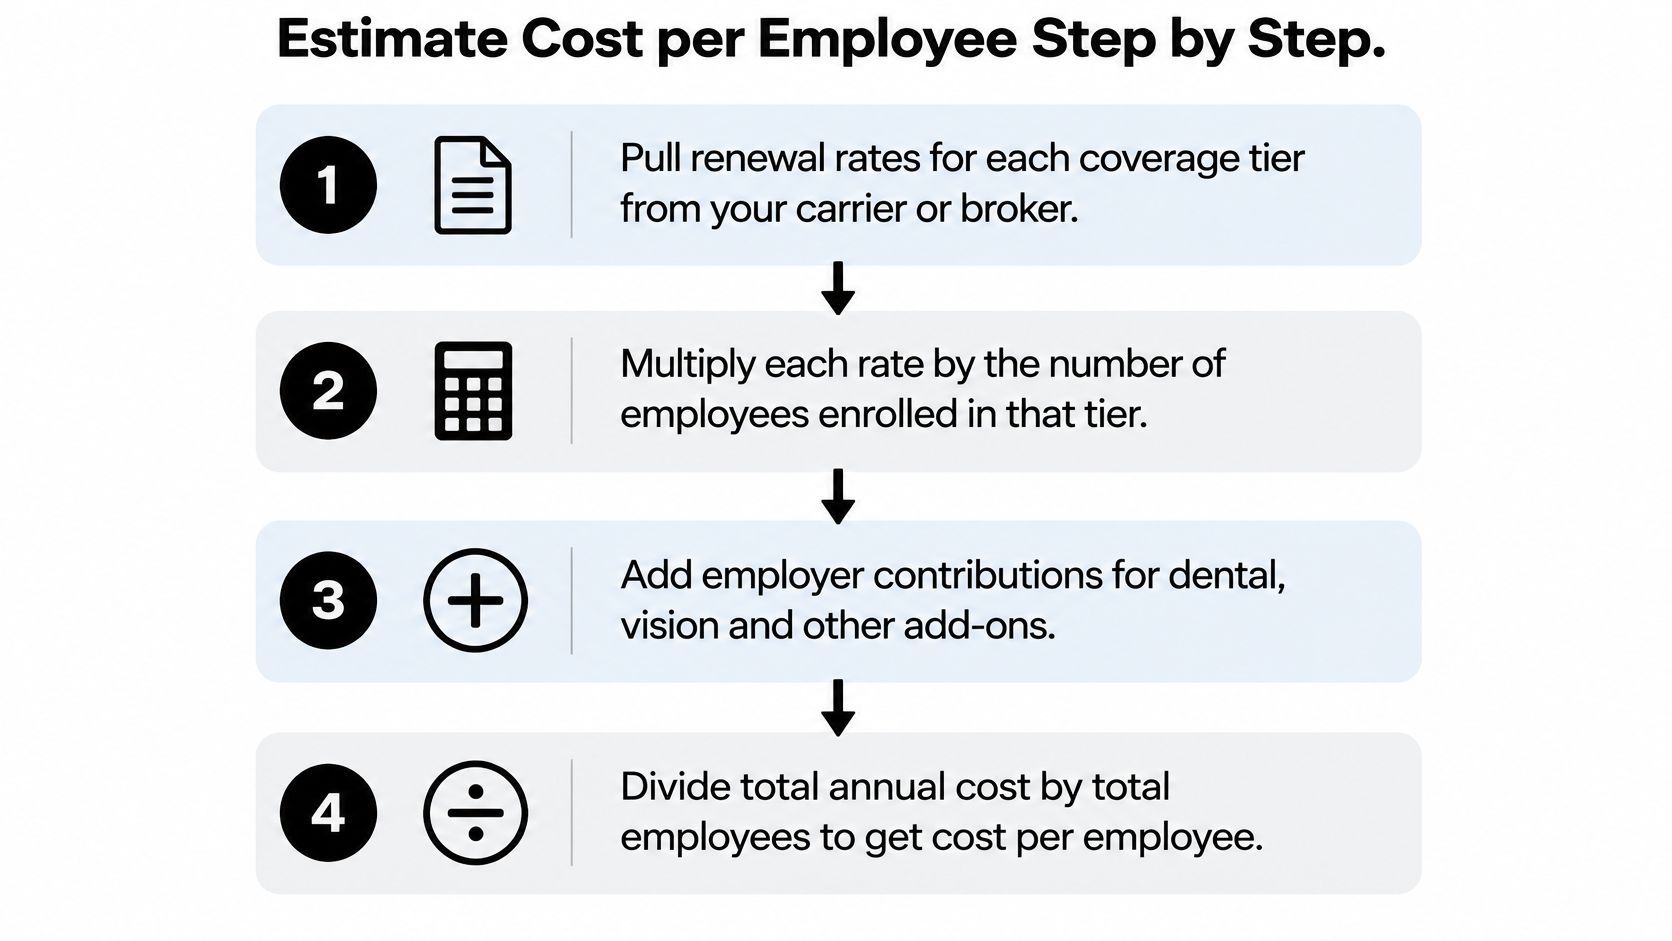
Build an auditable annual calculation
Pull renewal rates by coverage tier. Get the carrier or broker's current rates for employee-only, employee-plus-spouse, employee-plus-child and family enrollment wherever offered. Use the same census for every proposal so enrollment differences don't masquerade as pricing differences.
Annualize rates and apply enrollment. Multiply each monthly rate by the months of coverage and the employees enrolled in that tier. Keep current enrollment separate from anticipated hires, departures and coverage changes.
Apply the contribution policy. Split each premium total into employer funding and employee payroll deductions. If you use a flat-dollar allowance rather than a percentage, calculate the employer payment at the tier level and check that it doesn't exceed the premium.
Add account funding and service charges. Include employer HSA or FSA contributions, dental and vision subsidies, and administration, broker or PEO fees. Mark fees already included in another invoice so you don't count them twice.
Calculate the retirement commitment. Apply the match formula to eligible payroll using a realistic participation assumption. Show the assumption explicitly rather than treating every employee as though they contribute enough to receive the maximum match.
Add statutory costs and other included benefits. Include employer Social Security, Medicare, unemployment insurance and other applicable obligations. If you're comparing against a broad compensation benchmark, include paid leave and supplemental pay using a consistent accounting method.
Divide by full-time equivalents. Use the same FTE method across budget periods and label it as your budgeting method, not automatically the method used for tax or compliance purposes. Reconcile the resulting total to your annual employer expense.
Check the premium split before judging value
In KFF's report on employer-sponsored family coverage, the average 2025 annual premium was $26,993, workers contributed $6,850, and employers funded approximately $20,143. The employer's budget should use its subsidy, not the entire plan premium.
The employee contribution still belongs in your recruiting analysis. A candidate evaluates what leaves their paycheck, not just what the employer spends behind the scenes.
Budget check: There isn't a defensible universal benefits-cost range for every small business. If your figure differs materially from the broad benchmark, identify the line item and workforce characteristic that explain the gap.
A low figure may reflect limited enrollment rather than efficient purchasing. A high figure may reflect family coverage, a substantial retirement contribution or broader accounting scope rather than an overpriced medical plan.
What Employees Really Pay in a Bad Year
A premium deduction shows only part of an employee's healthcare cost. In the KFF 2025 survey's findings on employee contributions, workers at firms with fewer than 200 employees contributed an average of 36% of family premiums, compared with 23% at larger firms. Twenty-nine percent of small-firm workers paid more than half the family premium, versus 5% at large firms.
That gap affects whether employees can afford to enroll and maintain family coverage. To see the potential exposure, separate premium contributions from what an employee may pay for covered care.
Employee cost by coverage tier
| Coverage tier | Average annual premium | Employee premium share |
|---|---|---|
| Employee only | $9,325 | Approximately $1,492, calculated using the national average 16% share |
| Family | $26,993 | $6,850 average contribution, approximately 25% to 26% |
These national figures are survey anchors, not small-firm quotes. The family contribution is the reported dollar average, so it may not equal the rounded percentage multiplied by the premium.
Model the maximum covered-care exposure
For each tier, record the deductible, in-network out-of-pocket maximum and employer account funding. Use the carrier's Summary of Benefits and Coverage, and distinguish individual limits from family limits.
For an illustrative employee-only case, assume a $50,000 annual salary, a $3,000 deductible and a $6,000 out-of-pocket maximum. Replace these assumptions with actual payroll and carrier figures before making a decision.
Adding the table's employee-only premium contribution to the assumed out-of-pocket maximum gives a modeled bad-year cost of $7,492, or about 15% of salary, before employer account funding. This is an example calculation, not a survey finding.
For covered in-network care, deductible spending generally counts toward the out-of-pocket maximum. Do not add the deductible to that maximum. Premiums, uncovered services and costs outside the plan's protections require separate consideration.
Compare plans under the same bad-year conditions
A lower premium can come with greater cost-sharing exposure. Compare the annual payroll deduction and out-of-pocket maximum for each plan, then account for any employer HSA contribution.
The KFF 2024 Employer Health Benefits Survey reported an average employee share of family premiums of 25%, compared with 26% in the subsequent survey. That small change is a reason to check affordability, not a forecast of an individual employer's renewal.
A manageable monthly deduction does not guarantee an affordable bad year. Compare the modeled total with the pay of the employees likely to enroll.
How Company Size and Funding Model Change Costs
Company size affects the funding arrangements available and the amount of claims volatility a business can absorb. A larger employer does not necessarily pay less for equivalent coverage. Enrollment, location, underwriting rules and plan design all affect proposals, so firm-size categories are a starting point, not a quote.
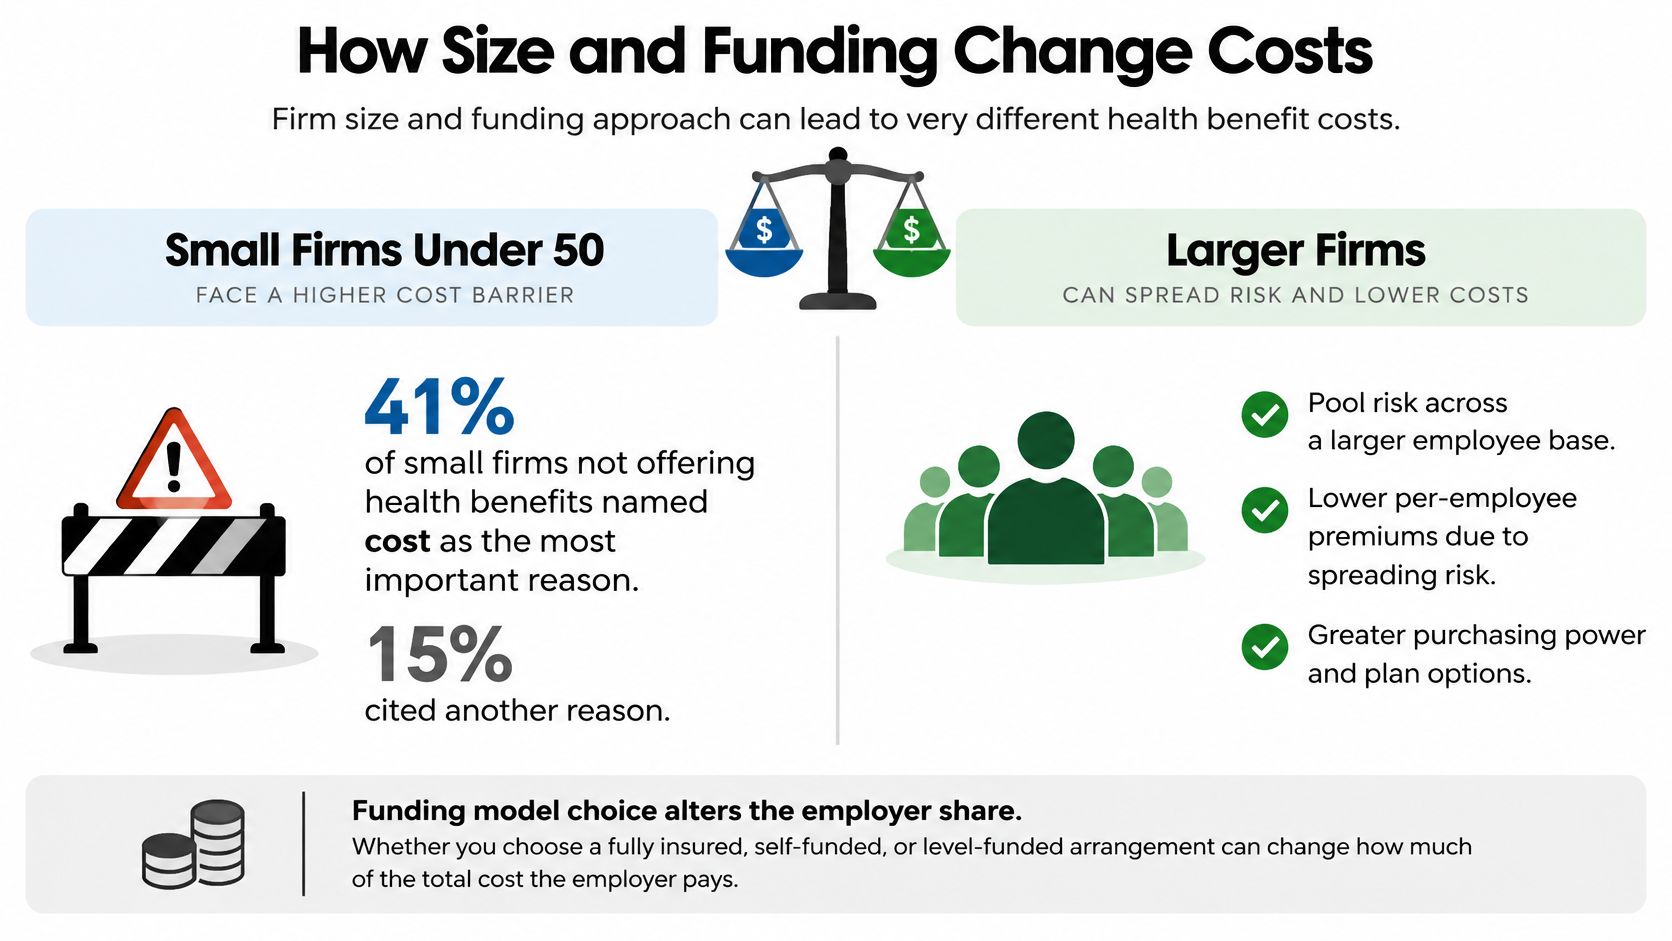
Compare the risk, not just the monthly payment
| Funding structure | How payment works | Budget advantage | Financial question |
|---|---|---|---|
| Fully insured | Employer pays a premium; carrier bears covered claims risk under the policy | More predictable premium expense during the contract | What changes at renewal? |
| Level-funded | Monthly payment combines claims funding, administration and stop-loss arrangements | A scheduled payment with potential contractual reconciliation | Who retains surplus, and what obligations survive termination? |
| Self-funded | Employer funds covered claims, often with administration and stop-loss support | Greater visibility and control over plan spending | Can the business absorb claims volatility and timing differences? |
A level-funded arrangement is not fully insured coverage with a guaranteed refund. Surplus treatment, claims settlement, stop-loss terms and renewal conditions depend on the contract. An arrangement may not return all unused funding, and a year-end deficit may not automatically mean an additional payment.
Stop-loss coverage also does not remove every cash-flow risk in a self-funded arrangement. Review reimbursement timing, exclusions, limits and responsibility for claims incurred before termination.
Match the contract to financial capacity
For a self-funded arrangement, ask for a contract-based illustration showing expected expense, maximum contractual exposure and the cash required when claims arrive. An overview of self-funded insurance arrangements can help clarify the structure, but the contract determines the obligations.
National averages do not provide a reliable quote for a specific industry and location. Request proposals using employees' locations, relevant ZIP codes and industry classification, then check which rating inputs apply to each arrangement.
Benely works with businesses of 2 employees or 2,000 employees, offering the same service, products and support at either size. It serves clients with 1 to 500+ employees.
The deciding question is how much claims variability the business can absorb in a bad year without disrupting payroll or operations.
Tax Credits and Compliance Costs That Change the Math
A tax credit may reduce benefits expense, but it does not lower the premium due to the carrier. Keep gross premiums and any confirmed credit as separate budget lines so the business can see both the cash required and the potential tax benefit.
| Credit eligibility item | Budget treatment |
|---|---|
| Employee count | Calculate full-time equivalents under the applicable IRS method |
| Average wages | Check the threshold for the tax year being claimed |
| Employer contribution | Verify the required contribution and uniform-percentage rules |
| Credit percentage | Confirm the applicable year's rate and employer category |
| Other eligibility conditions | Have the tax adviser verify the complete rules before recognizing savings |
The IRS Small Business Health Care Tax Credit rules describe eligibility for employers with fewer than 25 full-time-equivalent employees, with two half-time employees counting as one, and an employer contribution of at least 50% under the uniform-percentage requirement. The page's historical material lists maximum credits of 35% for eligible small employers and 25% for eligible tax-exempt employers. Treat those rates as historical, not as current-year estimates.
Separate historical arithmetic from a claimable credit
For illustration, at the historically cited 35% rate, an eligible employer paying $100,000 in qualifying premiums would calculate $35,000 before other applicable restrictions. This is arithmetic based on a historical rate, not a forecast or confirmation of eligibility.
The credit can decrease as employee count and average wages rise. Ask a tax adviser to confirm current thresholds, rates, qualifying coverage and other conditions before including a credit in the budget.
Price the work required to stay compliant
Compliance has a labor cost as well as a filing cost. Track each task, its owner, expected hours, internal labor cost, any outside fee and its deadline.
- Reporting: Employer reporting duties depend on employer size and plan type. Use the ACA reporting requirements overview to understand which requirements may apply.
- Documents and notices: Assign responsibility for plan documents, required communications and updates.
- Enrollment administration: Budget for eligibility checks, payroll deductions, corrections and carrier reconciliation.
- Payroll records: Keep employee classifications, hours and deductions consistent across systems. Guidance on payroll systems for growing SME teams can help organize payroll processes.
Benely partners receive year-round employee advocacy, benefits and HR support, plus compliance and ACA guidance. Before approving the net budget, confirm the FTE calculation, average wages, contribution policy, applicable tax-year rules and internal workload.
Cut Costs Without Cutting Coverage
Start with a controlled comparison, not a lower premium. Hold the employee census and core plan terms constant, then test a carrier change, contribution change or administrative arrangement separately. Otherwise, you can't distinguish a purchasing improvement from a transfer of expense to employees.
A review should include both the insurance contract and the work required to administer it.

Broker and PEO models compared
| Model | How it works | Cost structure | Best fit | Watch for |
|---|---|---|---|---|
| Benefits broker | Shops carriers and manages plan design | Commission or fee per plan or service arrangement | Employers that want control of plan design | Fee disclosure and carrier options |
| PEO, or co-employment | Shares employer duties and bundles payroll and benefits | Per-employee fee plus premiums, subject to the proposal | Very small teams that want bundled HR | Whether savings exceed the per-employee fee |
Test savings without hiding trade-offs
Network changes can reduce quoted expense, but they're not coverage-neutral if employees lose access to needed clinicians. Check provider directories, hospital access and prescription coverage before treating the proposal as equivalent.
Contribution changes need similar scrutiny. A flat-dollar employer contribution can make the company's commitment easier to forecast, but it may leave employees responsible for more of a premium increase. Show that effect explicitly rather than calling the entire employer reduction a saving.
Use a comparison worksheet with these controls:
- Equivalent benefits: Match deductibles, cost-sharing, covered services and network access.
- Identical enrollment: Apply each proposal to the same employees and coverage tiers.
- Complete charges: Include implementation, administration, account and termination fees where applicable.
- Employee impact: Display payroll deductions and bad-year exposure alongside employer expense.
Wellness programs should address employee needs and, where available, appropriately aggregated claims information. We offer wellness programs aimed at improving employee health and productivity, but don't book an assumed claims reduction as guaranteed budget savings.
Require the delivery model to justify itself
A PEO may replace work your team currently performs, but bundling doesn't prove that total expense falls. Identify which payroll, HR and benefits tasks move outside the company and which remain with your staff.
Our Benefits Advisors manage insurance programs from plan design through compliance paperwork, and we partner with all the major PEO providers in the country. That allows a delivery-model comparison without assuming that co-employment is the right answer.
Decision rule: Accept a delivery-model change only when its documented financial and operating benefits justify its full cost, contract obligations and employee impact.
Compare employer expense, employee expense, and administrative effort in separate columns. Combining them too early can conceal who benefits from the change.
Set Your Budget Before You Choose a Provider
Choose your financial boundaries before reviewing vendor presentations. Otherwise, an attractive network, platform or bundled service can push the discussion away from what the business can sustainably fund.
Use a written budget worksheet during the decision process.

Turn the analysis into approval criteria
Establish the baseline. Use your reconciled annual employer cost per FTE, with coverage and administration separated. Identify the expenses that will change when planned hires join.
Set a payroll-based ceiling. Define the maximum employer benefits load using your own wage budget and financial capacity. Keep the broad national compensation benchmark as context rather than adopting it as a spending requirement.
Approve employee affordability standards. Model bad-year exposure for every offered coverage tier, including employee-plus-child once carrier figures are available. Decide which results require a different subsidy or plan option.
Verify tax treatment. Obtain current-year eligibility advice before recognizing a credit. Keep uncertain tax savings outside the amount available for contractual commitments.
Request at least three comparable proposals. This is a purchasing recommendation, not a market statistic. Give each broker, carrier or PEO the same census, coverage specifications and requested fee disclosures.
Select on total annual economics. Confirm every fee in writing and document who owns enrollment, payroll reconciliation, employee support and compliance tasks. Record the reason for choosing the proposal, not just its premium.
Include the workforce you actually plan to build
If your hiring plan includes international roles, evaluate those employment arrangements separately rather than applying a domestic benefits average. For businesses exploring that option, LatHire's Hire Latam talent resource can support the recruiting discussion; payroll, employment status and local obligations still need their own review.
At Benely, we shop, analyze and personalize group benefits, while the client makes the final decision. We also offer a free benefits score: rate your benefits process and receive a free 30-page benefits guide to help organize the review.
Keep the benefits decision connected to the broader compensation discussion.
Before any vendor call, answer this question in writing: What is the maximum we can spend per employee without losing the hires we need? A usable answer includes both the employer's ceiling and the employee affordability conditions the final proposal must satisfy.
Benely helps businesses shop, analyze and personalize group benefits, with support from plan design through compliance paperwork. Bring your renewal rates, enrollment census and payroll budget to Benely to compare options against your employer spending limit and employees' real healthcare exposure.