 Employee Benefits
 HR & Compliance
 Technology
 Wellness
 PEO Solutions

In healthcare, ROI means return on investment, and it's calculated as (benefits minus costs) divided by costs times 100. For employers, the question is whether a health program's cost is justified by medical savings, productivity gains, and better workforce outcomes.
A CHRO and CFO usually ask that question when the benefits invoice lands, open enrollment is looming, or a wellness vendor promises value without showing the math. If you lead benefits, you don't just need a definition, you need a way to prove whether the spend is paying off for the business and for employees.
Table of Contents
- Why Employers Ask What ROI in Healthcare Means
- Defining Healthcare ROI and Clearing the Confusion
- The Healthcare ROI Formula and Benefit Cost Ratio
- Measuring ROI for Employee Health Programs
- Worked Examples and Benchmark Figures
- Improving and Reporting ROI in Your Benefits Strategy
- Frequently Asked Questions on Healthcare ROI
Why Employers Ask What ROI in Healthcare Means
Employers usually ask about healthcare ROI when the budget feels tight and the stakes feel high. A benefits leader may be defending a care management program, a wellness incentive, or a new plan design while finance wants a simple answer, does this lower total cost or not?
That question is fair, but it's also incomplete. A credible employer answer has to account for up-front spending, future savings, and the fact that some benefits don't show up immediately in claims data. The ROI language appears because decision-makers need a common yardstick, one that can compare a health intervention with other investments competing for the same dollars.
What a good employer answer sounds like
A useful answer doesn't start with hype. It starts with the intervention, the expected savings path, and the time horizon, then it explains where the value comes from, whether that's fewer avoidable claims, lower turnover pressure, or better engagement.
Practical rule: if a vendor can't explain what gets better, by how much, and when it shows up, the ROI number isn't ready for a budget meeting.
That's why healthcare ROI matters so much for employers. It turns a broad conversation about “wellness” into a decision about risk, spend, and measurable value.
For employers comparing plan strategy and cost control options, a practical starting point is to review health insurance cost considerations for employers. The point isn't to chase the cheapest plan, it's to understand which investments produce durable value for the workforce.
Why this matters to benefits leaders
Healthcare ROI also helps employers separate good intentions from financial outcomes. A program can feel helpful and still fail to justify its cost if it doesn't affect utilization, claims, or retention in a measurable way.
At the same time, some programs pay back slowly. Prevention, chronic care support, and workflow improvements often create value later, which means a short review window can miss the ultimate payoff. That's why a benefits leader needs a longer lens than a simple month-to-month spend comparison.
Defining Healthcare ROI and Clearing the Confusion
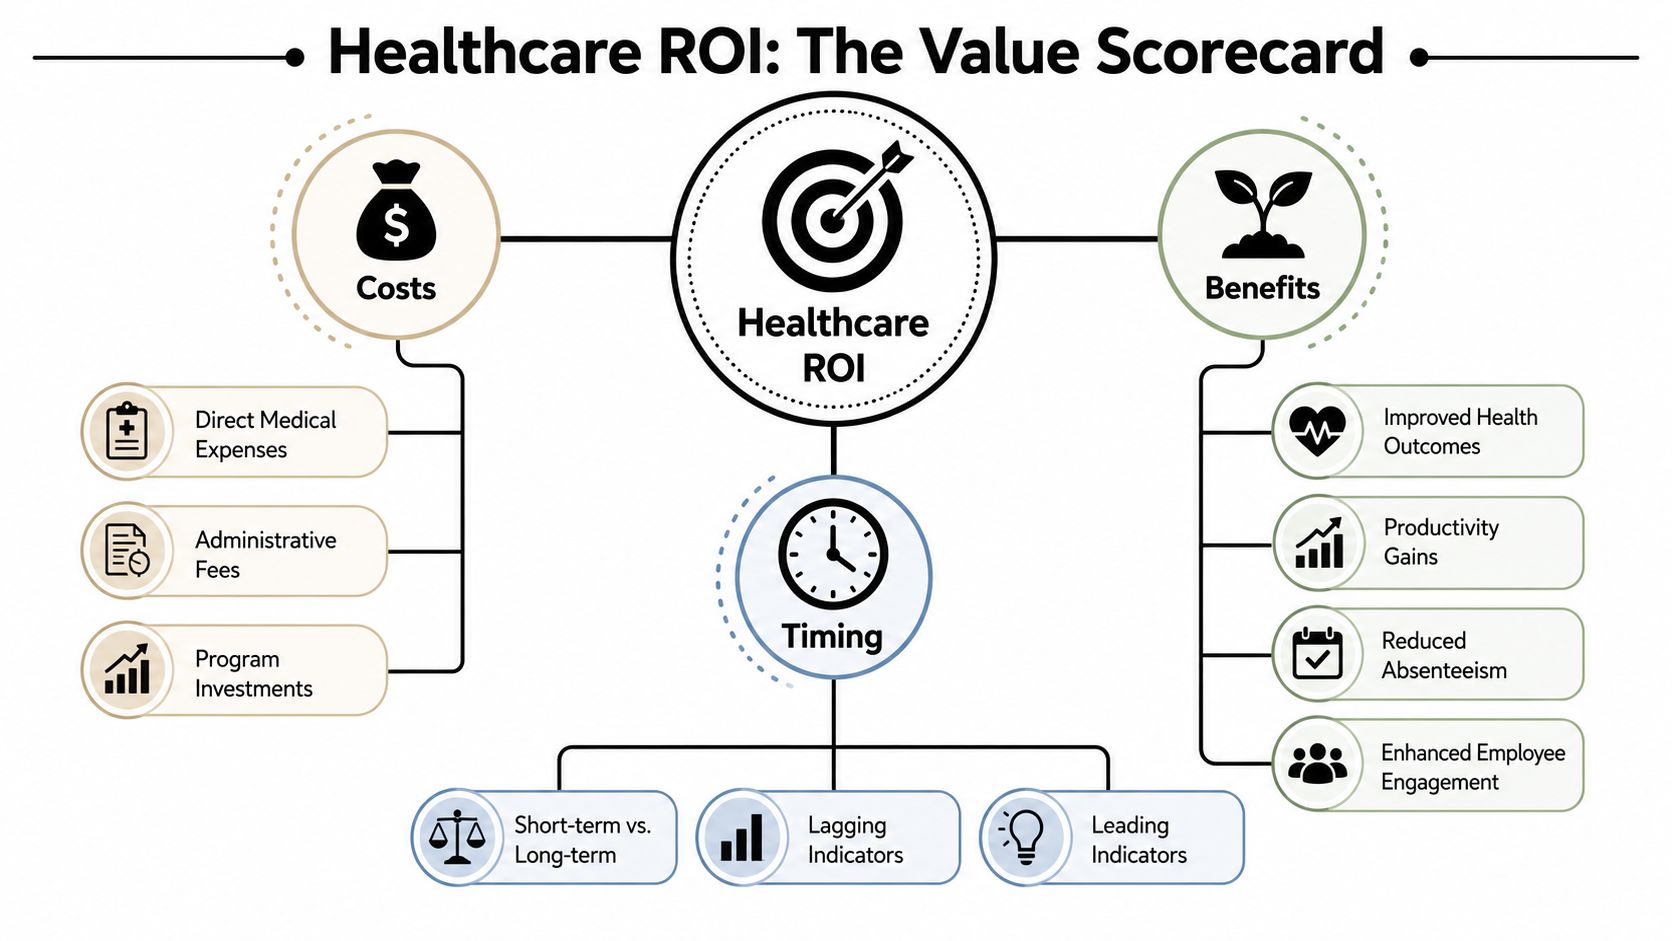
Think of healthcare ROI as a value scorecard, not a magic number. It pulls together three things, costs, benefits, and timing, then asks whether the value created is large enough to justify the money spent.
The concept is broad because healthcare itself is broad. A program might reduce claims, improve access, raise productivity, or keep people from delaying care. The value can be financial, human, or both, which is why a single line item rarely tells the whole story.
The three parts that always matter
Costs include direct spend on the program, related administration, and any implementation burden. Benefits can include lower medical claims, fewer missed work hours, improved employee engagement, and better health outcomes. Timing matters because a program can look weak if you measure it before the benefit has had time to appear.
That's why the same health investment can look very different depending on the evaluation window. A prevention program may barely move a short-term spreadsheet, yet still be strong over a longer horizon because it avoids more expensive problems later.
The healthcare field also uses ROI in another sense that causes real confusion. In clinics and records workflows, ROI often means release of information, which refers to the controlled disclosure of medical, billing, and imaging records to authorized requestors. That's a different topic entirely from financial return, and searchers often mix the two without realizing it.
If you're mapping healthcare evidence, implementation, and outcomes together, tools for OMOP-based HEOR can be a useful reference point for structuring analysis and aligning data to outcomes. That matters because benefits leaders often need the same discipline even when they're not running a formal research project.
The Healthcare ROI Formula and Benefit Cost Ratio
The standard formula is simple, ROI = (benefits − costs) / costs × 100. In healthcare, that formula is paired with the related benefit-cost ratio, which is benefits divided by costs.
The difference matters. ROI gives you a percentage, while benefit-cost ratio gives you a multiple. In benefits conversations, the multiple is often easier to explain, because leaders can hear “how much comes back for each dollar spent” faster than they can interpret a percentage.
Why healthcare often uses both measures
The ROI Institute's healthcare framing uses the same basic math as other sectors, but it defines ROI as the net monetary benefits divided by project costs and the benefit-cost ratio as benefits divided by costs (ROI Institute healthcare definition). That distinction helps employers avoid talking past each other in finance reviews.
Historical healthcare research also shows why one universal number doesn't work. A widely cited New England Journal of Medicine study estimated that every additional dollar spent on overall U.S. healthcare services from 1980 to 2000 produced health gains valued at $1.55 to $1.94 under the study's base-case assumptions, but specific Medicare-covered treatments varied a lot, from $1.10 for heart attack treatment to $4.80 for breast cancer (NEJM study). That variation is the point, healthcare ROI depends heavily on the intervention.
A public-health review makes the same point from a different angle. It found a median ROI of 14.3:1, with 27.2:1 for nationwide interventions, and another review reported returns ranging from 125% to 3900% for major public-health programs (ROI Institute chapter). In plain English, prevention and population health can produce very large returns, but the size of the return depends on the program, population, and timing.
If you're evaluating a benefit like weight-management support or a GLP-1-related intervention, it helps to think about total value, not just sticker price. A resource like finding affordable GLP-1 therapy can help frame cost conversations, even though ROI still requires your own employer data.
A useful way to read the numbers
A high ratio doesn't automatically mean a better employer decision. A small program with modest savings can still be the right choice if it's easy to deploy, low risk, and aligned with a specific workforce need.
Healthcare ROI is not a scoreboard with one right answer. It's a comparison tool for choosing the intervention that creates the most value for your specific population.
For employers, that means the formula is only the start. The harder work is deciding which benefits count, when they count, and whether the result is strong enough to support the next budget cycle.
Measuring ROI for Employee Health Programs
The practical challenge is turning care outcomes into money. AHRQ notes that healthcare returns can come from increased revenue, reduced costs, or both, and the same program may also create non-financial value that's harder to fit into one ratio (AHRQ ROI toolkit).
That's where employers often get stuck. Medical spend is easy to see, but productivity, absenteeism, engagement, and utilization shifts need a method before they can become part of an ROI calculation. A short spreadsheet that ignores delayed benefits will usually understate prevention and care-management value.
Start with the levers you can actually move
The first step is to define the program's expected effect in plain language. If you're launching a care navigation benefit, the likely levers might be fewer avoidable claims, better adherence to appropriate care, and less waste from fragmented utilization.
If you're evaluating engagement-related interventions, a useful reference point is cost of disengaged employees AU, because engagement problems often show up in health programs as missed participation and weak follow-through. That doesn't mean every engagement issue has a direct dollar label, but it does mean the employer should treat participation as part of the value picture.
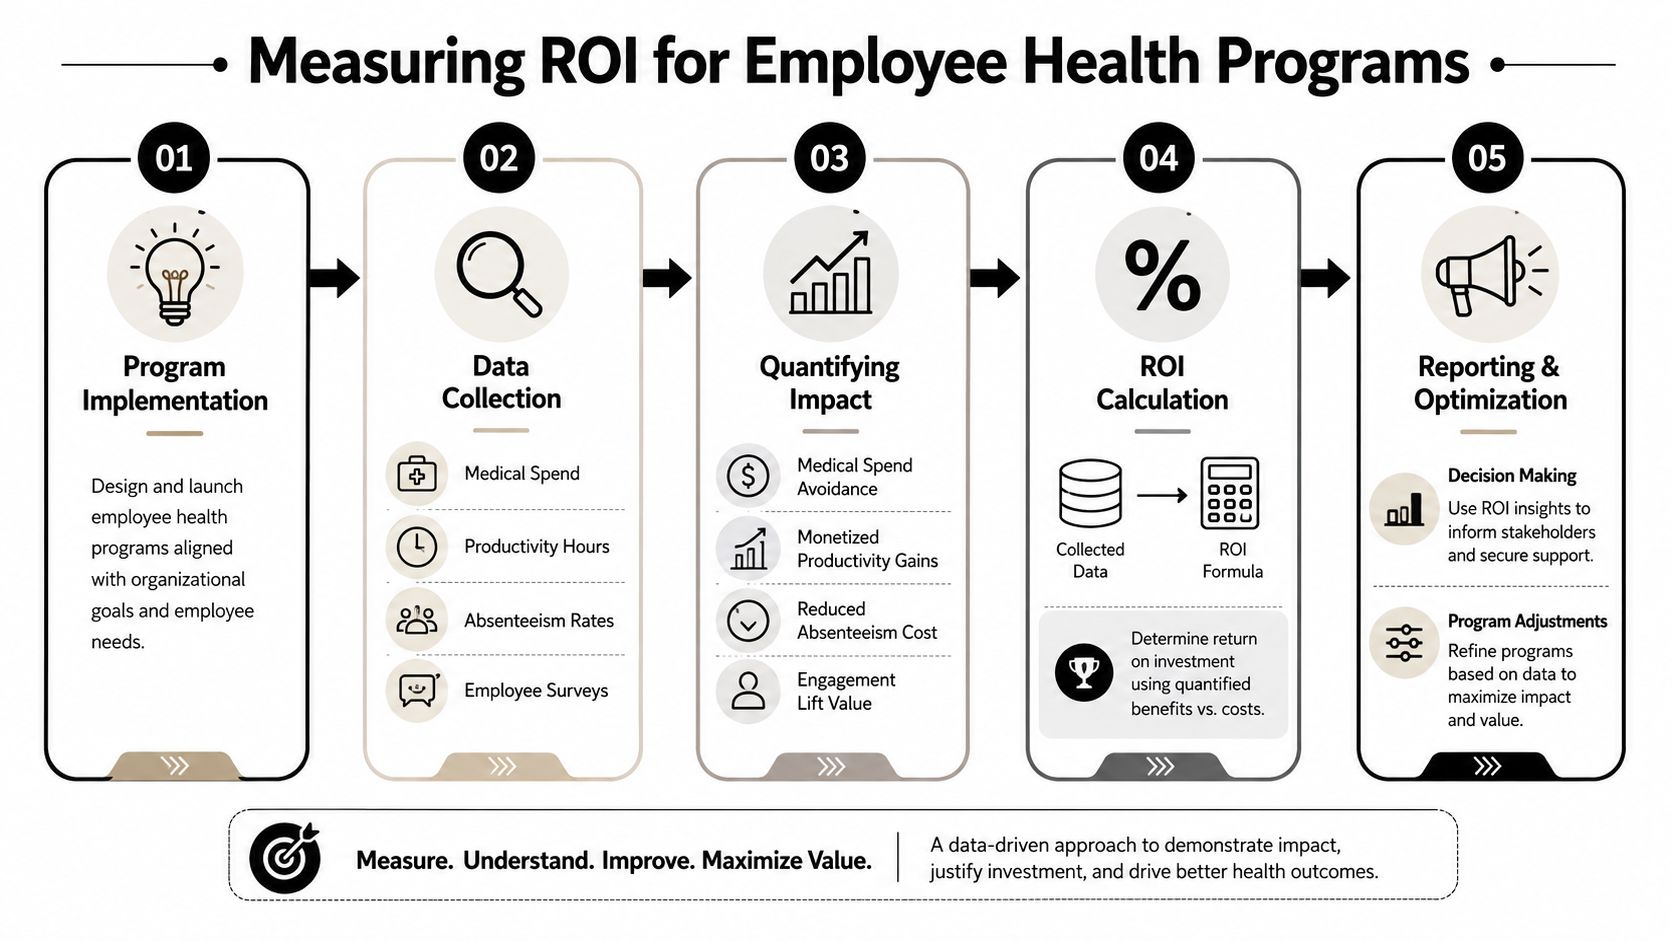
For measurement, build around four buckets:
- Medical spend avoidance: compare expected claims with actual claims after the program starts, then isolate what changed.
- Productivity gains: translate recovered work time into a dollar value using employer pay assumptions.
- Absenteeism cost reduction: convert fewer missed hours or days into wages or lost output avoided.
- Engagement lift: use participation, retention, or survey movement as supporting evidence, even when it can't be fully monetized.
Don't miss timing and attribution
A good ROI model also separates early signals from late outcomes. Utilization changes may appear before claims savings, while true financial payback can lag.
That's why employers should document baseline data before launch, then compare against the same metric after implementation. If the program affects multiple levers at once, note which ones are monetary and which ones are supporting indicators.
For a broader benefits strategy context, employee wellness incentive programs are useful to study because incentives often drive participation before they drive savings. The incentive itself isn't the ROI, it's part of the mechanism that may produce it.
Worked Examples and Benchmark Figures
A practical healthcare ROI model in the literature uses three steps, the initial balance, the annual balance, and the time to recovery until the investment is repaid (3-step model example). That structure works well for employers because it forces the conversation away from vague promise and toward cash timing.
Take a benefit program with meaningful up-front setup work. In year one, the employer records the initial outlay and any immediate savings. In later years, the analysis shifts to the annual balance, then asks how long it takes before cumulative savings catch up to the first-year investment.
How the three-step model feels in practice
The logic is simple even when the numbers aren't. If the program changes care-seeking behavior slowly, the first year may look soft, but the later years can look stronger once avoidable costs drop and employee experience improves.
The literature example reported a 3.8-year time to recovery and €36,476 after 8 years (same source). That example is useful because it reminds employers that a program can be worthwhile even when the payback curve is not immediate.
Here's a quick benchmark table drawn from the research base:
| Source Context | Reported ROI |
|---|---|
| Overall U.S. healthcare services, NEJM historical analysis | $1.55 to $1.94 per additional dollar spent |
| Heart attack treatment | $1.10 |
| Stroke treatment | $1.49 |
| Type 2 diabetes treatment | $1.55 |
| Breast cancer treatment | $4.80 |
| Innovation examples in healthcare | $1.12 to $38.00 per dollar spent |
| Public health interventions, median overall | 14.3:1 |
| Nationwide public health interventions, median | 27.2:1 |
| Local public health interventions, median | 4.1:1 |
| Community health worker subset | $2.92 for every $1 spent |
| Example with medical savings vs investment | 600% ROI |
| Early childhood health and development | up to $9 future costs saved per $1 invested |
| Tobacco prevention | up to $20 future costs saved per $1 invested |
How employers should use benchmarks
Benchmarks don't replace your own data. They help you tell whether a projected result sounds plausible before you sign off on a program.
If your expected return looks far beyond the research range, pause and test the assumptions. If it looks lower, check whether you're missing delayed savings or non-financial value.
That's the most useful employer lesson. The right benchmark is not a promise, it's a sanity check against overclaiming or undervaluing a benefit.
Improving and Reporting ROI in Your Benefits Strategy
A benefits program can look promising on paper and still miss the mark if no one sets clear targets from the start. The best place to begin is with the business result you want to improve, whether that is lower claims, better retention, less absenteeism, or easier care navigation.
Good reporting follows a simple pattern. Define a baseline, measure the same indicators at regular intervals, then adjust the benefit design when participation or outcomes slow down.

What to improve before you report
A useful report does more than list the result. It shows which parts of the program moved, which stayed flat, and what changed after you adjusted the design.
- Tighten the baseline: capture claims, participation, absenteeism, and engagement before launch so the later comparison is grounded.
- Use the same time window: compare like with like, because mismatched measurement periods can distort the story.
- Separate hard and soft value: present financial savings separately from non-financial gains so finance leaders can read the result clearly.
- Review the design, not just the score: if ROI is weak, the issue may be the benefit design, the communications plan, or the timing.
The report becomes stronger when it connects the numbers to the business discussion. Executives want to know whether the program supports budget discipline, workforce stability, and member experience, not just whether a metric changed.
For employers that want a cleaner way to review benefit performance, Benely care management services can help organize support around the members who need it most, while keeping the broader benefits picture easier to track. That kind of structure matters because ROI is easier to defend when the underlying process is clear and measurable.
Make the report useful to finance and HR
The best reports stay brief and make the assumptions easy to follow. They explain what was measured, what was left out, and what should be watched next.
Start with the levers you can move. If the benefit is working, say where it is working. If it is too early to judge, say that too. Clear reporting builds trust, and trust helps keep a good program funded.
Frequently Asked Questions on Healthcare ROI
How do delayed benefits affect annual ROI? They can make year-one results look weak even when the program is working. Prevention, chronic care support, and workflow changes often need time before the savings show up, so annual ROI should be read alongside longer-term trend data.
What non-financial value should employers document? Track access, employee confidence, engagement, and satisfaction when the program affects those areas. Even when those outcomes don't fit neatly into the formula, they help explain why a benefit is performing well or why participation is stronger than the claims data alone suggests.
Why do small pilots still need a cost baseline? Because even small tests consume money, time, and staff attention. Without a baseline, you can't tell whether the pilot created value or only felt promising.
A good rule is to treat ROI as both a finance question and a program design question. If the numbers are soft, tighten the assumptions, and if the timeline is short, give the benefit enough runway to show its effect.
Benely helps employers compare plan options, simplify enrollment, and keep benefits data organized so ROI conversations are grounded in real numbers instead of guesswork. If you're trying to make healthcare spend easier to defend and easier to improve, visit Benely and see how a cleaner benefits process can support better cost, engagement, and reporting decisions.