 Employee Benefits
 HR & Compliance
 Technology
 Wellness
 PEO Solutions

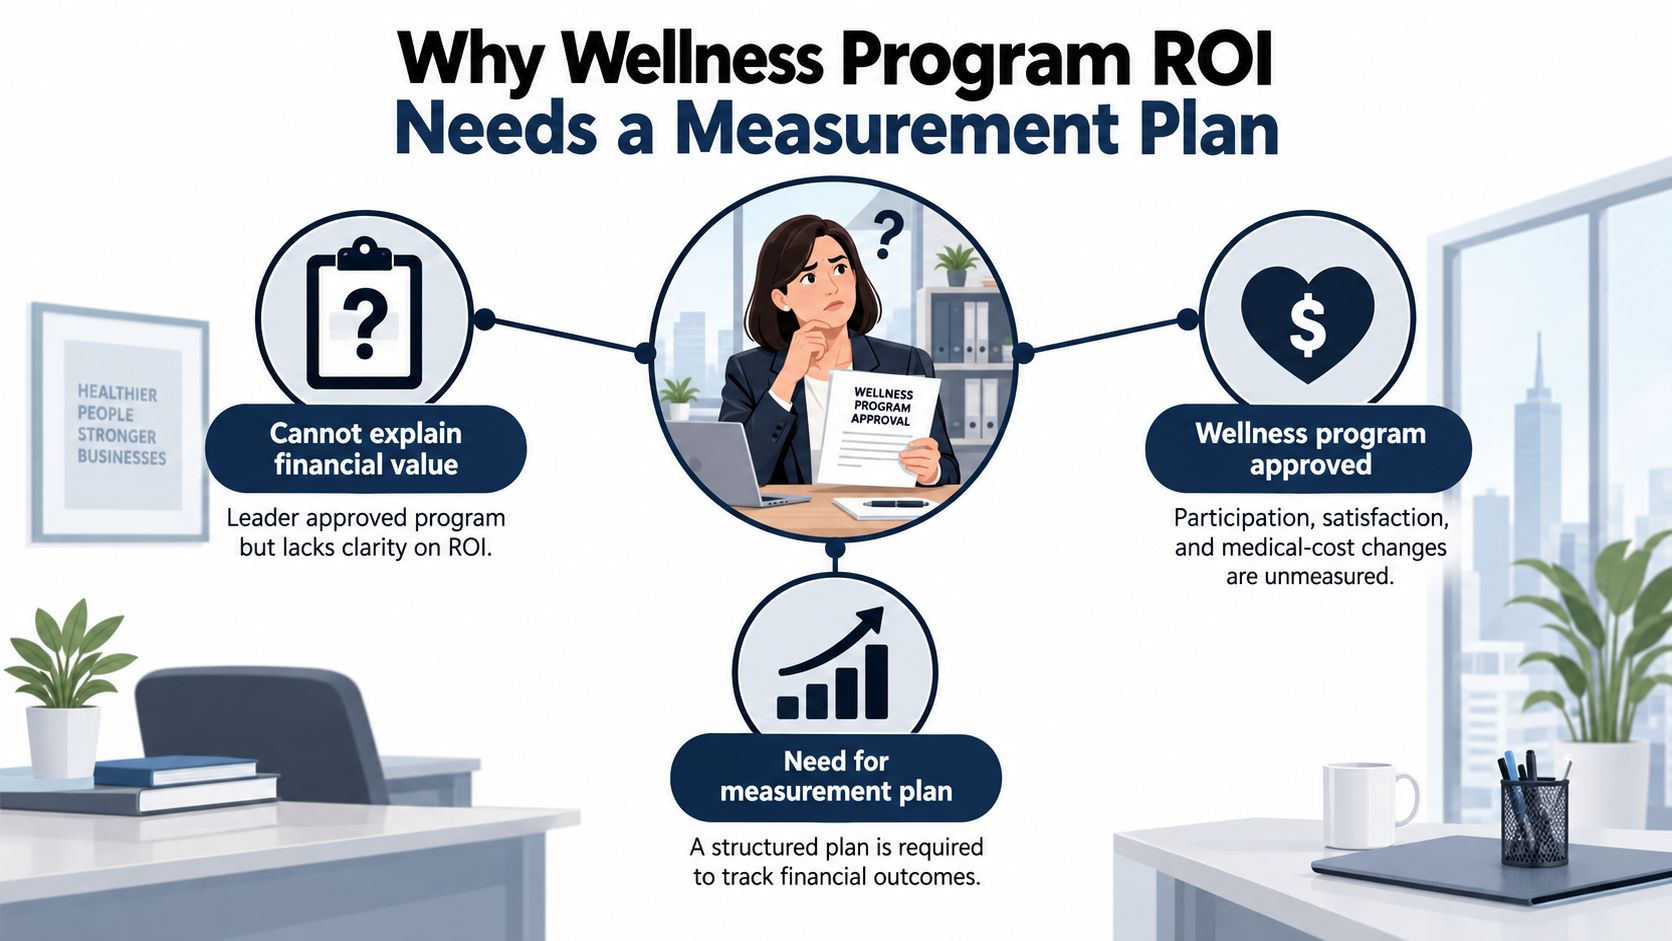
An SMB benefits leader presents the wellness budget at a finance meeting. Employees have signed up, feedback is positive, and the vendor's dashboard shows activity. Then the CFO asks whether the program reduced costs, improved attendance, or helped employees stay. Participation alone can't answer that question.
A defensible wellness program ROI analysis starts by deciding what the business needs to learn, then comparing outcomes against a credible baseline. The aim isn't to find one impressive benchmark. It's to determine what value the program may have produced, how confidently the company can attribute that value to the program, and what to do next.
Table of Contents
- Why Wellness Program ROI Needs a Measurement Plan
- Choose Metrics That Reflect Business Value
- Calculate Costs and Benefits Separately
- Test Attribution With Benchmarks and Sensitivity Analysis
- Apply the Method to SMB Case Scenarios
- Present Wellness ROI to Stakeholders
- Improve ROI Through Better Program Decisions
Why Wellness Program ROI Needs a Measurement Plan
A benefits leader who can report that employees enrolled has evidence of reach, not financial return. Satisfaction indicates how participants feel about the offering. Medical spending shows what the plan paid. Each measure answers a different question, and none alone establishes that the program caused an improvement.
That distinction matters because wellness programs differ in purpose. RAND's 2013 study covered nearly 600,000 employees at seven large employers and found an overall ROI of $1.50 for every $1 invested, with disease management generating most of the measured savings (RAND's Workplace Wellness Programs Study). That result is a historical benchmark, not a promise for a smaller employer or a broad lifestyle program.
Write the decision before measuring
Start with the decision the analysis will support. Is the company deciding whether to renew a vendor, redesign access, invest in chronic-condition support, or expand a pilot? Then define the target population, intervention period, primary financial outcome, leading indicators, and who owns each data source.
A one-page measurement charter can record:
- Decision and population: What choice is pending, and which employees are eligible?
- Baseline and comparison: What period defines normal conditions, and what group or trend will serve as a comparison?
- Outcomes and owners: Which financial result matters most, and who supplies claims, payroll, absence, or participation data?
- Timing and caveats: When will results be reviewed, and what workforce or plan changes could affect interpretation?
Where possible, gather at least 12 months of baseline data before launch. Record changes in insurance plans, staffing, locations, payroll rules, and vendors so a shift in costs isn't automatically attributed to wellness. For a wider perspective on how employers organize workplace health support, find corporate health solutions as one resource to review alongside the company's own goals and constraints.
Separate early signals from realized value
Participation, screening completion, and reported behavior are leading indicators. They show whether employees encounter or use the intervention. Medical spending, missed work, and other monetized outcomes are closer to realized financial value, but still need a comparison before they can support a causal claim.
Segment results by relevant worksite, job type, shift, age, disability status where lawful, and language. This helps HR identify who can access the program and helps finance understand which populations the analysis represents. A benefits partner such as Benely can be a natural next step for teams looking to connect benefits workflows with a practical measurement approach.
Choose Metrics That Reflect Business Value
A balanced dashboard is more useful than one headline ROI. Choose measures that connect to the program's purpose, and assign each one a source, owner, and review cadence before launch.
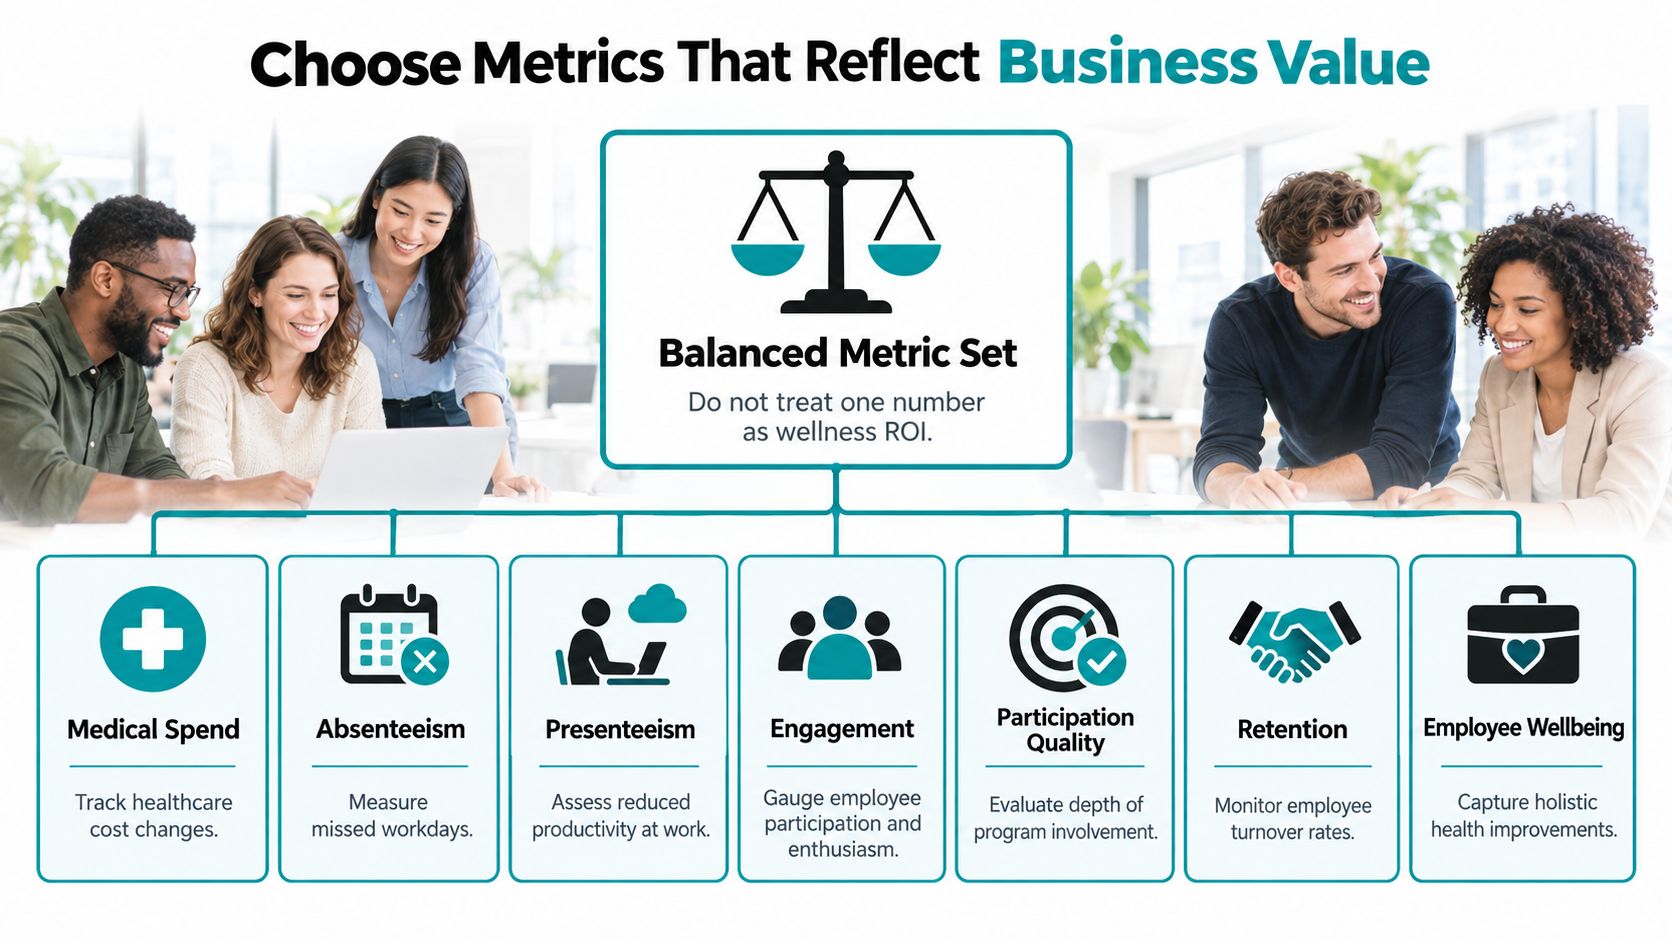
| Measure | Likely source and owner | Interpretation caveat |
|---|---|---|
| Medical spend | Claims reporting, managed by benefits or finance | Plan design and workforce mix can change costs independently of wellness. |
| Absenteeism | Payroll or timekeeping, managed by HR | Absence rules and recorded leave practices can affect comparisons. |
| Presenteeism | A consistent employee survey, managed by HR | Self-reports indicate perceived work impact, not necessarily dollars saved. |
| Engagement and participation quality | Vendor reports, checked by the program owner | Enrollment or app use doesn't prove health improvement or financial return. |
| Retention and employee wellbeing | HR records and appropriately designed surveys | Other workplace changes may influence turnover, trust, and reported wellbeing. |
Review source data at an agreed cadence that fits the reporting systems, and keep definitions consistent. For SMBs without enterprise analytics, a payroll export, claims summary, and vendor participation report may be enough to build a small, transparent dashboard. A benefits partner can help connect enrollment and vendor workflows, but the employer still needs to define the outcomes and protect employee privacy.
A large cluster-randomized trial involving 32,974 employees found more employees reporting regular exercise and active weight management after 18 months, but no statistically significant differences in health-care spending, absenteeism, tenure, or job performance (JAMA trial findings). That's a practical warning: behavior changes matter as progress signals, but they shouldn't be presented as financial savings.
For teams reviewing wellbeing initiatives beyond physical health, financial wellness in the workplace can be considered as a distinct program area. Keep its goals and measures separate from health-program outcomes so the dashboard remains interpretable.
The video below offers additional context for thinking about employee wellbeing as part of a broader workplace conversation.
Calculate Costs and Benefits Separately
The denominator is often wider than the vendor invoice. Include vendor fees, incentives, employee time, HR and manager time, communications, screenings, administration, and the cost of measuring results. If an employee spends paid work time on program activities, that time has a cost even when no separate invoice appears.
Use transparent formulas:
- Net benefit = measured benefits minus total program costs.
- Benefit-cost ratio = measured benefits divided by total program costs.
- ROI percentage = (measured benefits minus total program costs) divided by total program costs, multiplied by 100.
- Payback period = the time required for cumulative measured benefits to equal program costs.
Keep medical-cost ROI and absenteeism ROI separate. For total ROI, add only benefits that represent distinct value. If an absence reduction is already monetized as recovered labor capacity, don't count the same hours again as productivity gains.
Use illustrative assumptions, not borrowed results
Consider a fictional SMB with a hypothetical $10,000 in total program costs. Suppose its analysis estimates $6,000 in medical savings and $2,000 in absence-related value. Under those illustrative assumptions, net benefit is -$2,000, the benefit-cost ratio is 0.8, and ROI is -20%. These figures demonstrate the arithmetic only. They are not evidence of typical results.
If the absence estimate is uncertain, calculate low, expected, and high values rather than presenting the expected case as fact. For example, report the medical-cost view separately, then show how total ROI changes under different defensible absence assumptions. Clearly label every scenario as modeled, not observed.
A systematic review found that only two of 25 U.S. economic evaluations combined high methodological rigor with lower selection-bias risk, and those studies found no evidence of positive short-term ROI (systematic review of worksite wellness programs). This is why a CFO presentation should show the calculation, inputs, and uncertainty, not just a ratio.
Test Attribution With Benchmarks and Sensitivity Analysis
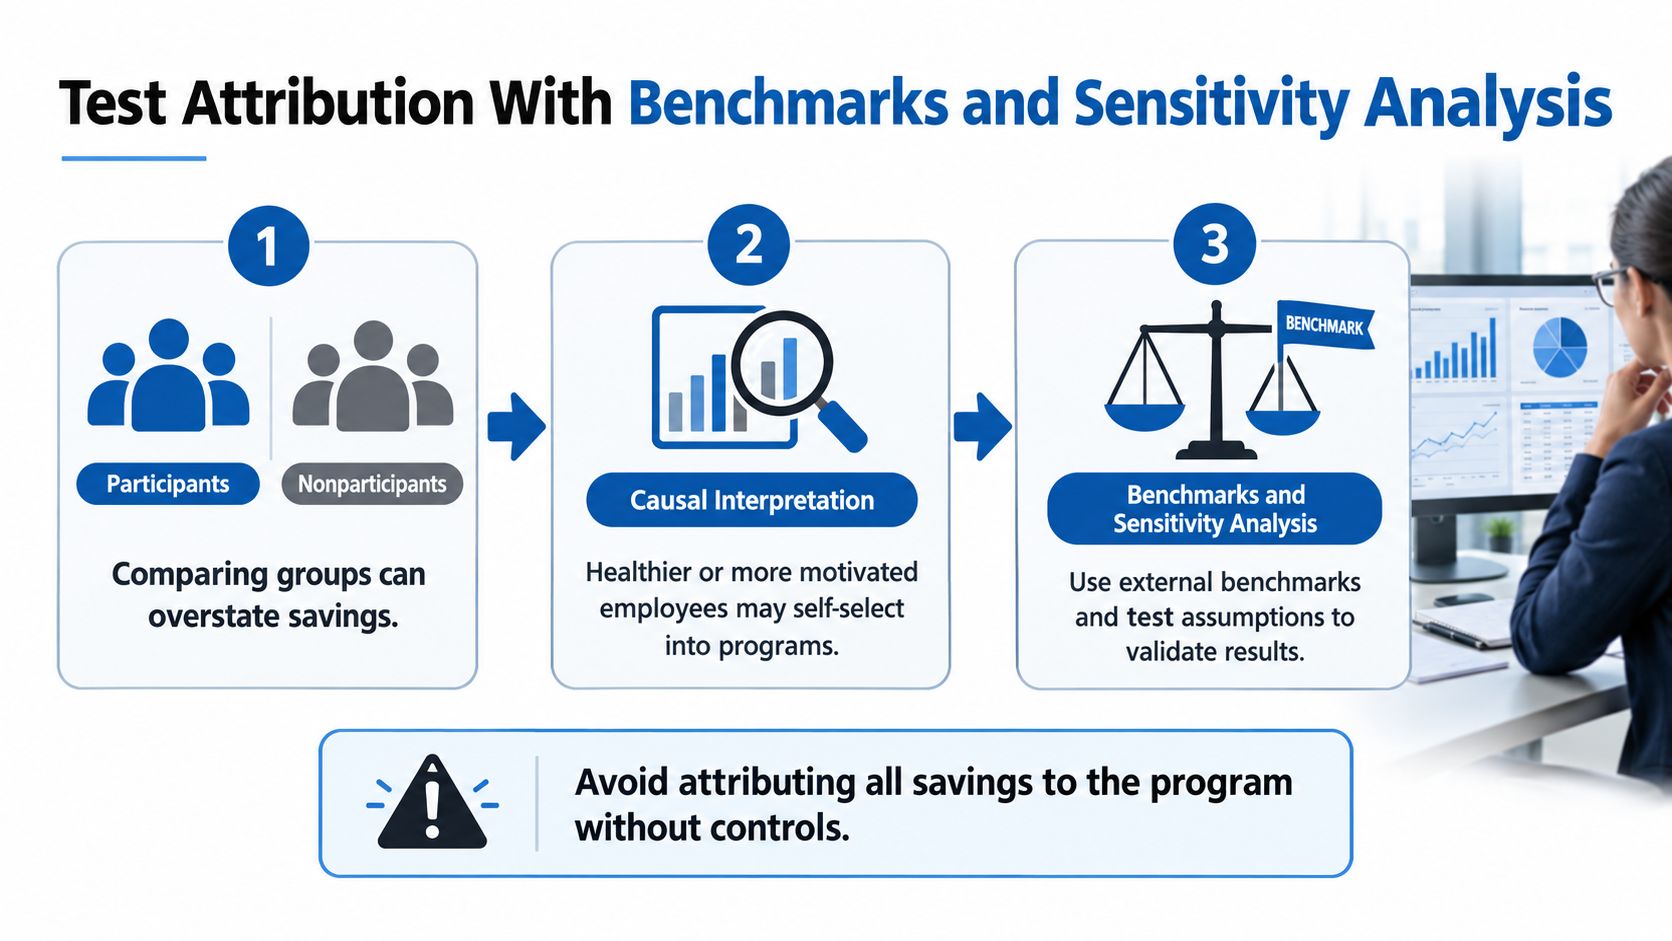
Arithmetic doesn't establish causation. Employees who choose a program may already be healthier or more motivated than those who don't participate. A simple participant-versus-nonparticipant comparison can therefore make the program appear responsible for differences that existed before enrollment.
Match the design to the employer's capacity
A randomized rollout offers a strong comparison when the employer can implement it fairly and operationally. If that isn't practical, a matched comparison group or staged rollout can help. A repeated pre-post analysis is easier to run, but it's less able to separate the program's effect from other changes, such as insurance redesign or staffing shifts.
Before launch, name the primary outcome and document how it will be calculated. Compare groups with similar baseline characteristics where possible, adjust for known differences, and track users' outcomes before enrollment. These steps won't remove every source of uncertainty, but they make assumptions visible.
External benchmarks provide context, not a substitute for a company-specific comparison. A CDC evidence summary reports employer returns ranging from $3 to $15 per $1 invested, while evaluations show wide variation in medical-cost savings (CDC summary of workplace health-promotion evidence). Treat that range as a description of varied evidence, not a forecast for your business.
Stress-test the result
Run low, expected, and high scenarios for assumptions that can materially change the result, such as absence valuation, participation, or program cost. If the conclusion changes when one reasonable assumption changes, the result should be presented as uncertain, not definitive. When the analysis supports them, report confidence intervals or another clear uncertainty range.
Practical rule: A positive modeled return is not the same as proven causal savings. Tell stakeholders what the data show, what the comparison can support, and what remains uncertain.
Apply the Method to SMB Case Scenarios
A renewal decision usually fails before the ROI formula. It fails when the outcome, comparison group, measurement window, and cost boundary were never pinned down.
A 75-person company testing chronic-condition support
Start with the decision: renew, narrow, or stop. The company defines medical spending and hospital utilization as primary outcomes, pulls baseline claims for eligible employees, and records who was offered the program, who enrolled, and who stayed engaged. Finance logs plan changes, hiring mix, and turnover during the same period so a plan redesign does not get credited to the intervention.
Use the math as a range with decision rules. As an illustration, if the program costs $18,000 and modeled benefits run from $9,000 to $27,000 after low, expected, and high assumptions, the modeled result spans a loss to a positive return. That spread changes the conversation: the company can renew only if enrollment quality and the comparison improve, or it can test a smaller cohort before expansion.
A 200-person company evaluating a broad program
A wider program needs an equity check before a financial claim. Compare participation by schedule, site, pay status, language access, and manager approval, because a higher average can hide low reach among hourly staff. HR can track survey behavior and participation quality, payroll can supply absence records, finance can review claims trend, and retention stays a separate line so it is not counted twice.
If behavior improves while spending, absence, and retention remain inconclusive, the honest result is a leading-indicator gain with unproven financial savings. The next test might extend the measurement period, redesign access for crews who cannot attend midday sessions, or replace a broad menu with one targeted service.
For option design, teams can review employee wellness program examples to frame choices, then keep definitions specific to their workforce. Benely, a benefits brokerage and HR solutions partner, can help centralize enrollment, eligibility, and reporting feeds so comparisons stay consistent across renewal cycles.
Present Wellness ROI to Stakeholders
A finance presentation should separate what the program cost, what changed, and how confidently the change can be attributed. Start with the decision at hand, then identify the measurement period, outcome definitions, comparison method, and any major changes in workforce or plan design.
A dashboard can keep the discussion grounded:
| Report line | What to show |
|---|---|
| Medical ROI | Claims-based result, comparison, and limitations |
| Absenteeism ROI | Absence measure and how missed time was valued |
| Total modeled ROI | Combined value after checking for double-counting |
| Engagement and reach | Participation quality, access gaps, and leading indicators |
| Data quality | Missing records, changes in definitions, and uncertainty |
Reported employer perceptions can provide background, but they aren't causal proof. A CDC-published review reported that employers in a 2015 Harris Poll Nielsen survey said their programs had positive effects on worker health (83.6%), performance or productivity (83.3%), and health-care costs (73.6%) (CDC review of workplace health-promotion programs).
If behavior improves but financial outcomes aren't statistically significant, say so plainly: employees reported a change in behavior, while the analysis hasn't established financial savings. Don't count participation, engagement, and medical savings as independent benefits if they reflect the same underlying change.
Stakeholder takeaway: Report hard financial outcomes, leading indicators, and uncertainty as separate lines, then tie each to a decision.
Improve ROI Through Better Program Decisions
A program's design and access affect what the employer can learn from its results. Before adding incentives or services, connect the intervention to a defined workforce need and make sure employees can realistically use it.
Use this checklist to improve both operations and analysis:
- Target a specific need. Choose an intervention that matches the problem the employer intends to address, then name the outcome that would support renewal.
- Remove access barriers. Check whether shift and hourly workers can participate, and adapt communications or delivery where work schedules, language, disability, caregiving, or broadband access create obstacles.
- Align incentives with the goal. Reward the intended behavior or participation, and evaluate whether the incentive reaches the employees it is meant to support.
- Connect systems carefully. Make vendor reporting, enrollment, benefits, payroll, and HR records usable together, with clear ownership and privacy safeguards.
- Change designs deliberately. Run staged tests where practical, preserve a comparison group, and change one major feature at a time so the employer can interpret the results.
- Agree on review points. Set measurement dates and definitions in advance, then document changes instead of adjusting the success criteria after results arrive.
For employers considering incentive design, employee wellness incentive programs can help inform program planning. The evidence on worksite health centers also identifies company size, utilization, and operating duration as important ROI drivers, while equity and operational access remain open questions for smaller employers (systematic review of worksite health-center economics). That reinforces a practical point: reach and access belong in the measurement plan, not only in program communications.
Before making a decision, ask whether the program has a documented purpose, a credible baseline, comparable outcome data, complete costs, and an uncertainty range. Continue the current design when evidence supports it, redesign when access or engagement is weak, test more rigorously when attribution is unclear, and expand when value is credible and the program can serve the intended population.
Next, confirm metric owners, check data availability, and schedule the review before the next renewal decision. Wellness program ROI is an ongoing management question, not a one-time benefits claim.
Benely helps SMBs manage benefits and HR workflows, benchmark programs, and connect enrollment and reporting processes that support a more disciplined wellness measurement plan. Visit Benely to discuss benefits strategy, benchmarking, and measurement workflows for your organization.