
Can the same $150 payroll deduction be affordable for one employee and unaffordable for another? Under the ACA affordability safe harbor, yes. And the verdict often has nothing to do with what either employee earns.
That trips up HR teams who treat affordability as one company-wide answer. The employer shared responsibility rules ask a narrower question about each individual: does the required contribution for the lowest-cost self-only plan exceed a percentage of that person's household income? Nobody in your payroll system holds household income data. So the IRS built three substitutes that use facts you do have, which are taxable wages, an hourly rate, or the federal poverty line.
Choose the wrong substitute, or carry last year's percentage into this year's schedule, and a plan that looks compliant can still generate penalty exposure. What follows is how each test works, where each number comes from, and why the 2027 percentage increase means every cap you set this year has to be rebuilt before open enrollment.
Table of Contents
- The Three Safe Harbors Employers Can Use
- How the Affordability Percentage Has Changed
- Choosing the Safe Harbor That Fits Your Workforce
- How to Run Each Safe Harbor Test, Step by Step
- Monthly Contribution Caps for 2026 and 2027
- Common Compliance Mistakes and How to Avoid Them
- Confirm Your Safe Harbor Before Open Enrollment
The Three Safe Harbors Employers Can Use
The statutory test fits in one sentence. Coverage is affordable when the employee's required contribution for the lowest-cost self-only plan providing minimum value does not exceed the applicable percentage of household income. Minimum value means the plan is designed to pay at least 60% of the total allowed cost of benefits expected under the plan, as the IRS guidance on minimum value and affordability explains.
Household income is where that sentence stalls. Payroll reports wages, not a spouse's salary or a freelancer's side income. The IRS closed the gap with three safe harbors that swap payroll data for household income: the Form W-2 safe harbor, the rate-of-pay safe harbor, and the federal poverty line safe harbor.
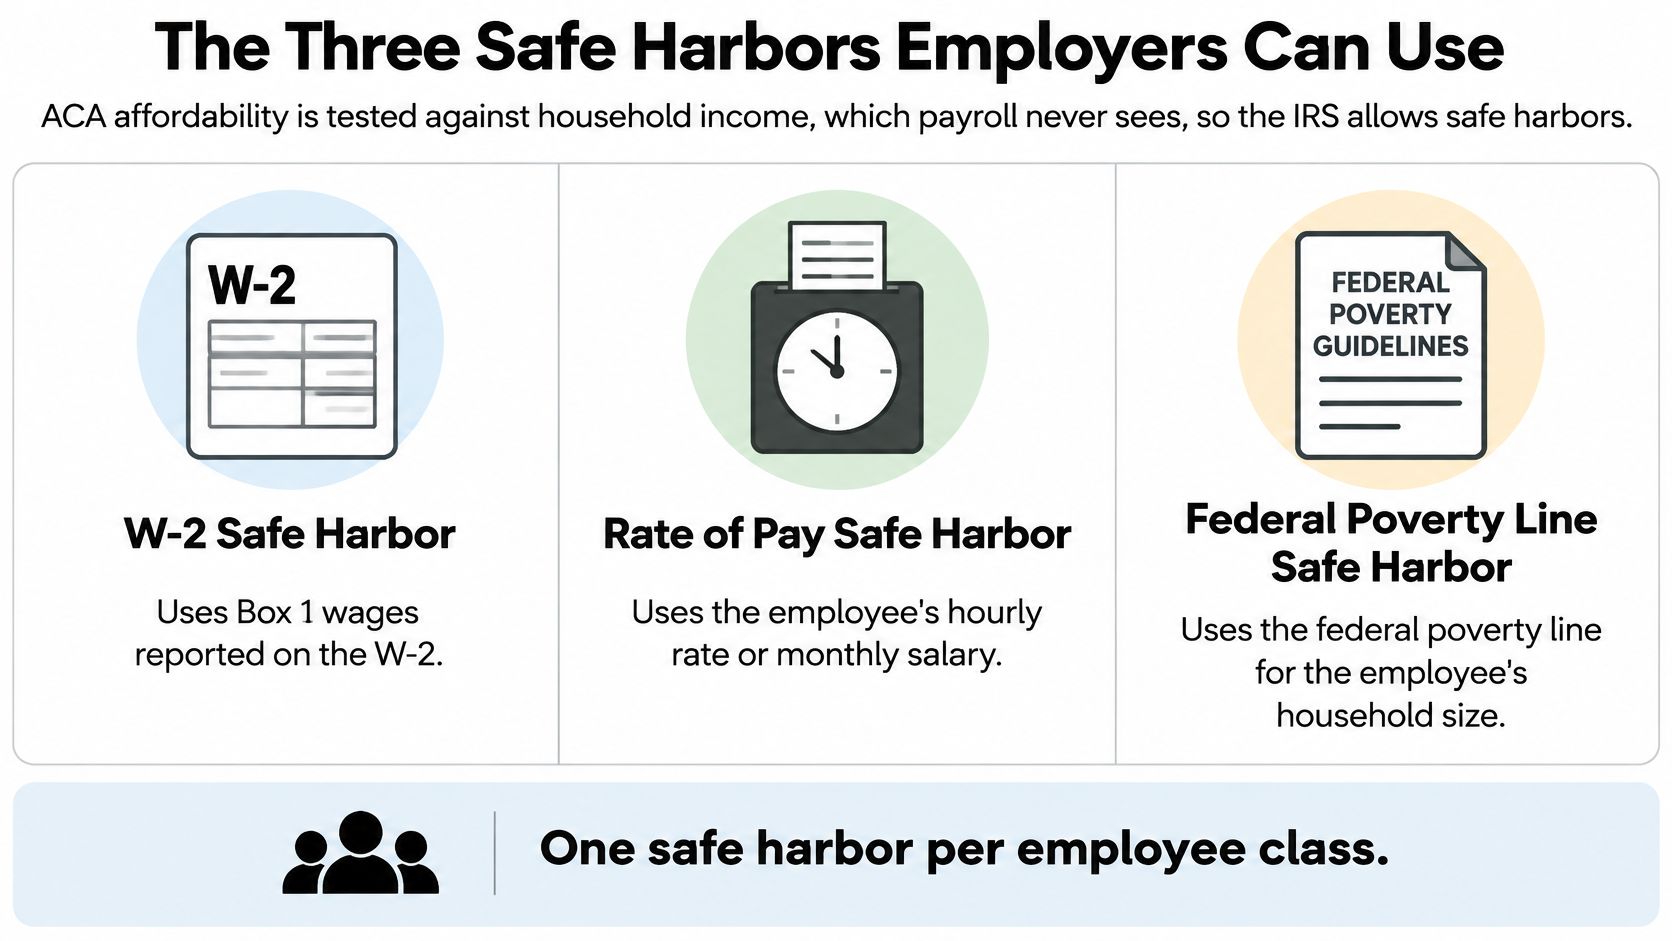
Each method answers the same question with a different income proxy, so the base you multiply matters as much as the percentage you multiply by.
| Safe harbor | Income measure used | Base the percentage applies to | Best fit |
|---|---|---|---|
| Form W-2 | Box 1 wages reported for the year | Annual W-2 wages (Box 1) | Steady payroll records and variable pay |
| Rate-of-pay | Hourly rate or monthly salary | Hourly rate × 130 hours, or monthly salary | Predictable pay and hourly workforces |
| Federal poverty line | 2026 poverty guideline for one person | $15,960 ÷ 12 = $1,330 a month | Lower-paid staff, most conservative test |
Run one line of 2026 math to see how the mechanics feel. The poverty guideline for one person is $15,960 a year, or $1,330 a month. At the 2026 applicable percentage of 9.96%, that produces a monthly cap of $132.47 for self-only coverage.
The last piece is governance, not arithmetic. Pick one safe harbor per employee class, document the choice, and apply it to everyone in that class. The three methods are alternatives, never a sample-as-you-go menu inside a single class. That discipline sits at the center of what ACA compliance looks like in practice, and it is what an auditor asks for first.
How the Affordability Percentage Has Changed
The ACA wrote 9.5% into the statute and handed the IRS an annual adjustment. That single design choice explains most of the confusion in this area. The IRS questions and answers on the employer shared responsibility provisions confirm that the same annually adjusted threshold governs both premium tax credit affordability for individuals and the employer shared responsibility affordability safe harbors.
The result is a figure that moves most years, sometimes up and sometimes down.
| Plan year | Affordability percentage |
|---|---|
| Statutory reference | 9.5% |
| 2015 | 9.56% |
| 2016 | 9.66% |
| 2017 | 9.69% |
| 2018 | 9.56% |
| 2019 | 9.86% |
| 2020 | 9.78% |
| 2023 | 9.12% |
| 2024 | 8.39% |
| 2026 | 9.96% |
| 2027 | 10.22% (scheduled) |
The recent stretch shows how far the number can travel in a short window. The percentage stood at 9.12% for 2023 plan years and 8.39% for 2024, according to EPIC Brokers' 2026 compliance newsletter. For plan years beginning in 2027, it is scheduled to climb to 10.22%, the figure HCAMag reported from IRS Revenue Procedure 2026-26.
One contribution, two plan years, two verdicts. A payroll deduction equal to 9.70% of the chosen wage measure would have failed a 2017 test at 9.69% and passed a 2020 test at 9.78%, assuming everything else was satisfied. Same contribution, same employee, opposite outcome, decided entirely by which year's percentage you applied.
Habit that prevents most errors: print the plan year and the exact percentage in the header of every contribution schedule you publish, and archive the prior year's version next to it.
Annual IRS revenue procedures set each figure, which means an older benefits guide, a stale payroll template, or a broker deck from two seasons ago is the most common source of failure. A percentage lifted from the wrong year doesn't announce itself. It produces a cap that is too high, and a schedule that looks fine until a penalty letter arrives.
Choosing the Safe Harbor That Fits Your Workforce
Start with the shape of your payroll, not with the method that sounds easiest. The right safe harbor is the one your data can support every month for the next twelve, applied uniformly to everyone in a class.

Where Each Method Fits
- Salaried staff with fixed pay: rate-of-pay suits this group because the monthly salary is known before the plan year starts. You can set the contribution ceiling in advance and stop recalculating.
- Hourly staff with steady schedules: rate-of-pay again, since the 130-hour monthly convention creates a predictable base that doesn't swing with overtime or a slow month.
- Staff with variable hours and clean payroll records: the W-2 method, because it uses actual annual Box 1 earnings and doesn't punish an employee for a seasonal spike or dip in hours.
- A workforce heavy with lower-paid employees: the federal poverty line method, which produces the lowest permissible contribution of the three.
That last point is the trade-off worth understanding before you commit. The poverty line is a low-income benchmark, so it can require a materially lower employee contribution than rate-of-pay or W-2 would allow. That's why it earns its reputation as the most conservative test. You absorb more premium, and in exchange one number covers every employee on the schedule.
Take an hourly employee at $15 an hour. Under rate-of-pay, the monthly base is $1,950 (15 × 130), and 9.96% of that is $194.22. Under the poverty line method, the cap is $132.47. A $150 monthly premium share passes the rate-of-pay test comfortably and fails the poverty line test by nearly eighteen dollars.
That's the whole argument for method selection in one employee: the same contribution, the same plan, two different answers.
Whichever method you choose, the class definitions need to line up with how you determine ACA benefits eligibility in the first place, or you'll end up with a compliance test that doesn't match your offer records.
Four things decide the choice. How reliable is your payroll data, month to month and not just in January? How predictable is pay across the year? What share of your workforce sits in the lower pay bands? And can your team administer two methods side by side without mixing them inside a single class?
How to Run Each Safe Harbor Test, Step by Step
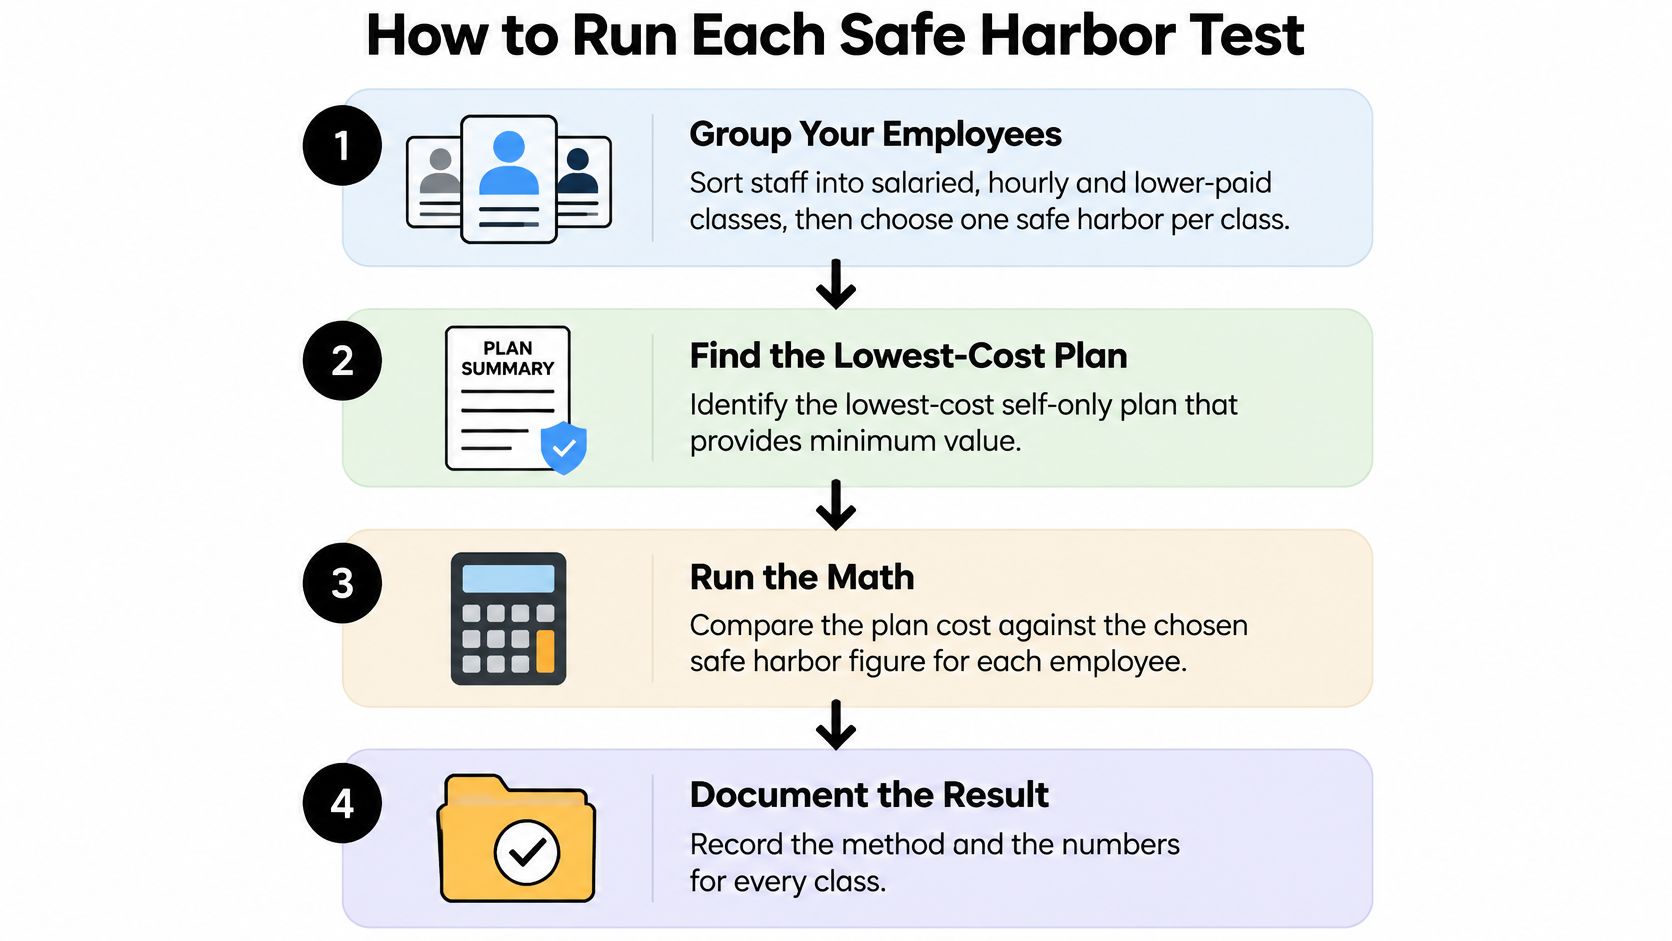
What makes a contribution pass one safe harbor and fail another? The answer is the calculation base: each test applies the affordability percentage to a different measure of income. Use the same steps each time, and document the method so the result can be reproduced later.
The Six Steps
- Group employees into classes. Salaried, hourly, and lower-paid staff can be useful starting groups. Choose a safe harbor for each class and document that choice before calculating.
- Identify the lowest-cost self-only plan that provides minimum value for the plan year. Test that option, rather than a richer or more popular plan.
- Find the monthly self-only contribution employees would pay for that plan. Use the amount deducted from pay after the employer contribution.
- Build the base for the chosen method. Rate-of-pay multiplies the hourly rate by 130 hours, so $20 an hour gives a $2,600 monthly base. The poverty line method uses $1,330 a month for 2026. The W-2 method uses annual Box 1 wages.
- Multiply the base by the applicable percentage. At 9.96%, $2,600 × 9.96% = $258.96, while $1,330 × 9.96% = $132.47. Round down to keep the cap conservative.
- Compare the contribution with the cap. A $250 monthly contribution passes the $20 rate-of-pay test; a $270 contribution fails it. For a failing contribution, consider lowering the employee share or using another safe harbor for that class.
For rate-of-pay, the baseline is the employee's rate at the beginning of the coverage period, under IRS guidance on the employer shared responsibility rules. The IRS baseline rule in the Internal Revenue Manual does not establish that rate-of-pay baseline, so rely on the applicable IRS guidance for the rule itself. If an employee's rate decreases, an employer may use the lower rate going forward. A later increase does not require recalculating the original baseline.
The same contribution can therefore produce different answers: $250 passes the rate-of-pay example above, but the poverty line cap of $132.47 would not allow it. The percentage also changes by plan year. The scheduled rise to 10.22% in 2027 means employers must recalculate caps before open enrollment rather than carry forward an earlier year's figures.
Close the loop with a record of the calculation date, plan year, percentage applied, plan tested, and employee class. That record makes it possible to explain the result months later without reconstructing the calculation.
Monthly Contribution Caps for 2026 and 2027
Two inputs drive every poverty line cap: the annual affordability percentage and the poverty guideline itself. Change either one and the ceiling moves, which is why a cap copied from a prior year's worksheet is a liability rather than a shortcut.
At the scheduled 2027 percentage of 10.22%, the federal poverty line safe harbor would cap the monthly employee contribution at $135.93, based on the 2026 guideline of $15,960 for the 48 contiguous states and Washington, D.C., as reported in Mercer's analysis of the 2027 affordability percentage. The 2026 cap is $132.47, so the move amounts to $3.46 a month of extra room per employee.
| Plan year | Poverty-line monthly cap | Rate-of-pay cap at $20 an hour |
|---|---|---|
| 2026 | $132.47 | $258.96 |
| 2027 | $135.93 | $265.72 |
The rate-of-pay ceiling shifts too. For an employee at $20 an hour, the 2027 figure is $265.72 (2,600 × 10.22%), up from $258.96 for 2026. That's $6.76 a month of additional headroom for that class, roughly double the movement on the poverty line side.
Now test a real contribution schedule against both years. An employee paying $134 a month for self-only coverage clears the 2027 poverty line cap of $135.93 with a dollar of margin. Run the same $134 against 2026 and it fails, because that year's ceiling is $132.47. Nothing about the plan changed. Only the percentage did.
Timing detail that matters: the 2027 cap above is calculated on the 2026 poverty guideline. When the updated guideline is published, that ceiling has to be recalculated, so treat $135.93 as your planning figure for now, not a permanent number.
Build the 2027 contribution schedule from these figures before the next open enrollment window opens, not during it. Rates get finalized in a rush, and a schedule assembled under deadline pressure is where stale percentages survive.
Common Compliance Mistakes and How to Avoid Them
A contribution can pass one safe harbor and fail another because each method uses a different reference point. Applying the wrong percentage creates an inaccurate cap, even if the schedule looks reasonable on paper.
- Using a stale percentage. Confirm the figure for the applicable plan year in the IRS revenue procedure, then record it on the schedule. A prior-year percentage can make the cap too high.
- Testing only at open enrollment. Recheck each class against its cap as pay changes during the year. Treat a raise or promotion as a prompt to review the calculation rather than waiting for the next enrollment cycle.
- Confusing the employer safe harbor with the premium tax credit test. A safe harbor concerns an ALE's exposure to an affordability penalty. Individual premium tax credit eligibility can involve household income and marketplace determinations, as explained in the IRS premium tax credit questions and answers. Keep these calculations separate.
- Forgetting the rate-of-pay baseline after a pay change. Record the baseline date and rate. A decrease in pay permits an adjustment to the reference point; a stale baseline can misstate the test.
- Mixing methods inside one class. Choose and document one method for each class so the results are consistent and easier to support.
Clear records tie the affordability calculation to the reporting decision. Each calculation informs the Line 16 code on Form 1095-C, so ACA reporting requirements depend on choices made earlier in the year. Benely's compliance evaluation helps ensure a client's ACA reporting, COBRA and ERISA filings are up to date and compliant.
Confirm Your Safe Harbor Before Open Enrollment
The scheduled rise to 10.22% is an opportunity, not a reprieve. It gives you room to set contributions slightly higher in 2027, and it also invalidates every cap you calculated for 2026. Work through the sequence below this week, while there's still time to change a rate before the enrollment window opens.

- Choose one safe harbor per employee class and write the choice into your plan documentation, including which class each job code belongs to.
- Recalculate every cap against the plan year's percentage, including the 10.22% scheduled for 2027 plan years.
- Set each contribution schedule so every self-only premium stays under its cap with a small cushion, not sitting on the line.
- Check results monthly as pay changes, and log the date of each check against the class it covers.
Use the numbers directly. The 2027 poverty line ceiling is $135.93 a month, and the 2027 rate-of-pay ceiling for an employee at $20 an hour is $265.72. Any self-only contribution above those figures for the relevant class needs a fix before enrollment, not after.
If the calculations need a second look, our compliance experts can review them. They also handle COBRA and FSA administration, ACA reporting, HR support, and ERISA wrap and filing, and access to certified HR experts sits inside the HR and Compliance service. OBEY Clothing worked with our certified HR professionals and ACA support experts and reached ACA compliance, which is the outcome the schedule review is designed to produce.
Here's a walkthrough of the affordability rules if you'd rather hear the framework before running the numbers.
One question is worth asking of any provider, broker, or payroll platform that touches your contribution schedule. Which safe harbor applies to each employee class, and which percentage was used to calculate the cap? A confident answer to both, with a date attached, is the sign that the work is being done rather than assumed.
Benely helps HR teams turn these calculations into a documented, defensible process, from selecting a safe harbor for each employee class to checking every self-only contribution against the right cap before open enrollment closes. If you'd rather not rebuild the 2027 schedule alone, our compliance specialists can review the math alongside your reporting, COBRA and ERISA filings. Visit Benely to see how the platform connects benefits, payroll and compliance in one place.