 Employee Benefits
 HR & Compliance
 Technology
 Wellness
 PEO Solutions
A renewal letter lands in your inbox, and the increase is large enough to disrupt the budget. Your CFO asks a simple question: how does this compare with companies like ours? You check the broker deck, the prior-year plan, and the carrier proposal. None gives you a defensible answer.
That's the problem with treating benefits as a yearly purchasing exercise. The benefits of benchmarking go beyond finding a lower premium. A useful benchmark shows whether your costs, plan design, employee burden, and workforce outcomes make sense together. It gives leadership a basis for decisions before open enrollment becomes an emergency.
Table of Contents
- The Renewal Increase That Woke Up the CFO
- What Benefits Benchmarking Actually Means
- Six Real Benefits of Benchmarking Your Program
- How to Run a Benchmarking Analysis Step by Step
- When Benchmarking Misleads and How to Fix It
- Why Size and Industry Matter More Than the National Average
- Turning Benchmark Data Into Decisions and Proof
The Renewal Increase That Woke Up the CFO
The CFO was looking at a renewal showing a 22% increase. The benefits leader had expected tough questions about the budget, but not that particular one. “What are other companies our size paying for comparable coverage?”
There was no clean answer. The team knew the current premium, the employer subsidy, and the employee payroll deductions. They didn't know whether the plan was unusually rich, whether the workforce had a different risk profile from its peers, or whether employees were already carrying more of the cost than comparable workers.
That uncertainty spreads quickly. Finance starts challenging the benefits budget. HR debates whether to increase employee contributions or reduce plan richness. Employees hear rumors about higher deductions. The leadership team worries that cutting coverage could damage retention, while leaving the plan untouched could make it unaffordable.

The market reference point
KFF's 2025 Employer Health Benefits Survey found average annual premiums of $9,325 for single coverage and $26,993 for family coverage. Family premiums rose 6%, or $1,408, in one year, according to KFF's employer-sponsored health insurance overview. Those figures don't tell you whether your plan is right for your workforce, but they provide a starting point for a serious renewal conversation.
The next question is more useful than “Can we get the increase down?” Ask: What are we buying, who pays for it, and what workforce outcome should it support? A plan can cost more because it offers broader networks, lower deductibles, richer coverage, or serves a workforce with different healthcare needs. A cheaper plan can simply move cost and access problems onto employees.
For a practical view of health insurance cost for employers, separate the carrier's proposed price from the total cost of the program. Include employer contributions, employee payroll deductions, out-of-pocket exposure, administrative effort, participation, and the consequences of changing plan design.
The CFO doesn't need another average. The CFO needs a defensible explanation of the gap, the tradeoff, and the decision.
Benchmarking supplies that explanation. It turns a defensive renewal meeting into a structured discussion about affordability, competitiveness, risk, and priorities.
What Benefits Benchmarking Actually Means
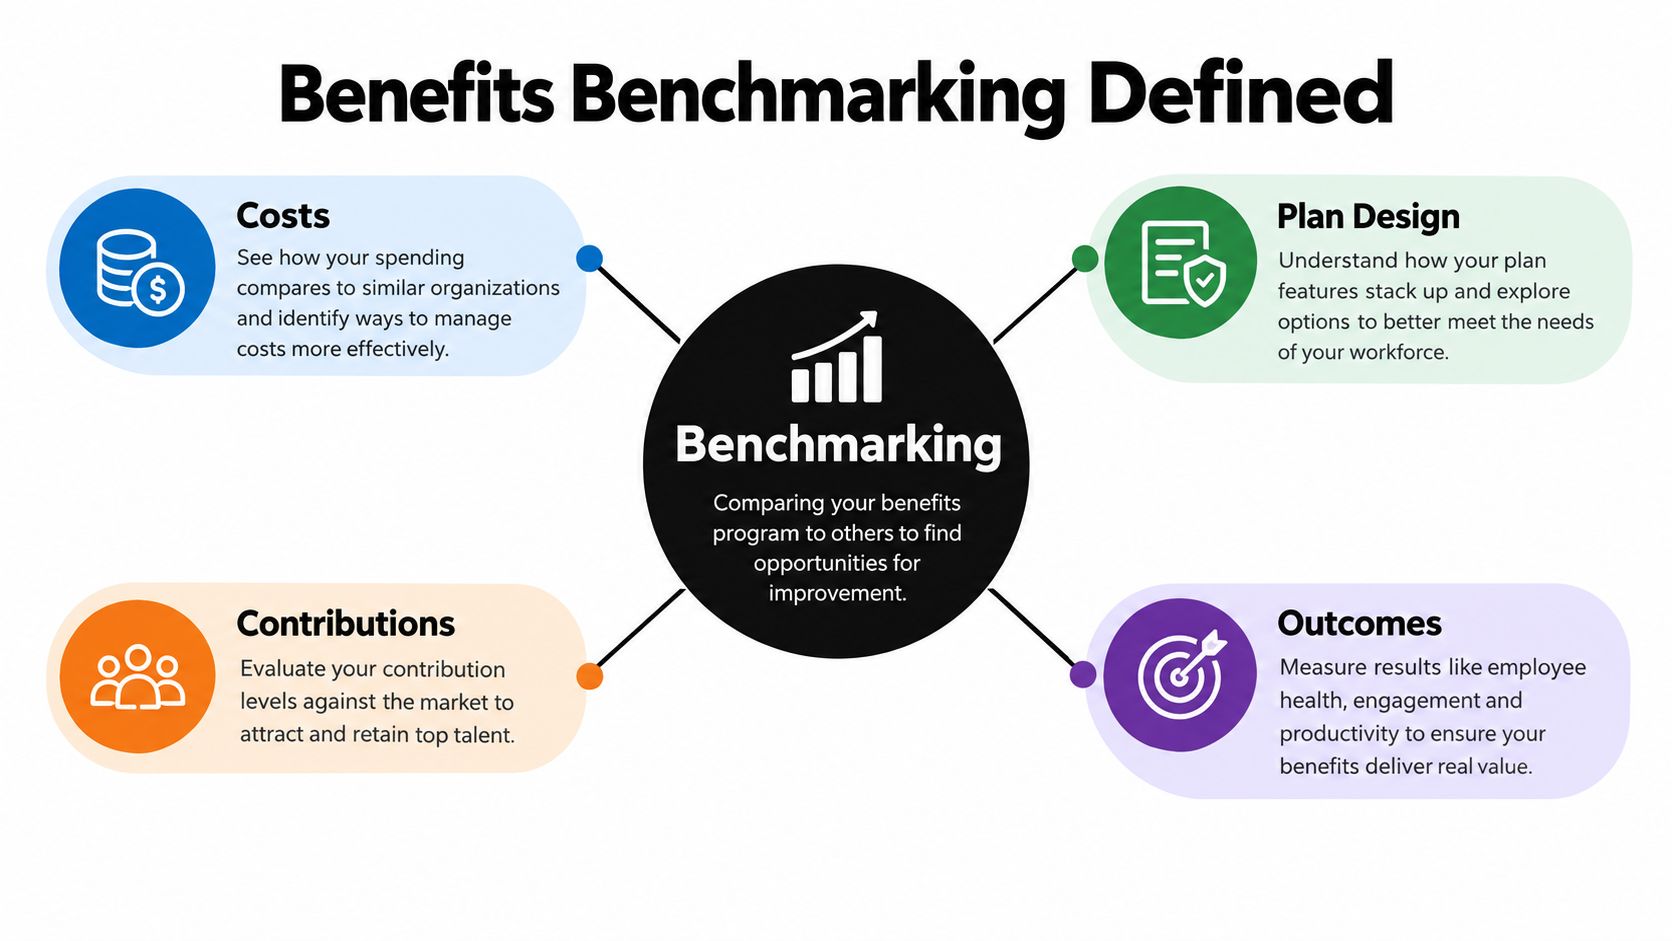
Benefits benchmarking is the comparison of your benefits program with a defined group of similar employers. The comparison should include costs, plan design, employer and employee contributions, utilization, enrollment behavior, and workforce outcomes.
That definition matters because benchmarking isn't the same as price shopping. Price shopping asks which carrier or plan has the lowest quoted premium. Benchmarking asks whether the price reflects the coverage employees receive, the contribution structure they face, the workforce risk the plan carries, and the results the company needs.
Four dimensions of a useful comparison
- Costs: Compare employer cost per enrolled employee, total plan spend, renewal movement, and administrative workload.
- Plan design: Examine deductibles, out-of-pocket exposure, actuarial value, network access, covered services, and contribution tiers.
- Contributions: Measure what the employer pays and what employees pay for employee-only and dependent coverage.
- Outcomes: Track enrollment completion, participation, service tickets, affordability, utilization indicators, retention, and employee sentiment.
The diagnostic question is, “Where are we out of line?” The governance question is, “Are we spending toward a defined workforce objective?” Those objectives might include retaining employees, improving engagement, supporting productivity, or making coverage more affordable.
The Chartered Institute of Personnel and Development's Reward Survey found that 77% of UK organizations had explicit objectives for their employee-benefits package, while 22% had none, creating a measurement gap that benchmarking can help close. The finding is detailed in the CIPD Reward Survey.
You don't need an enterprise analytics department to start. You need a consistent peer group, normalized measures, and a record of what decision each comparison supported. For teams building a repeatable process, benchmarking tools that work can help organize the broader discipline of comparing performance, identifying gaps, and following through.
Six Real Benefits of Benchmarking Your Program
Benchmarking earns its place in an SMB budget when it changes a decision. These are the six benefits that matter most.
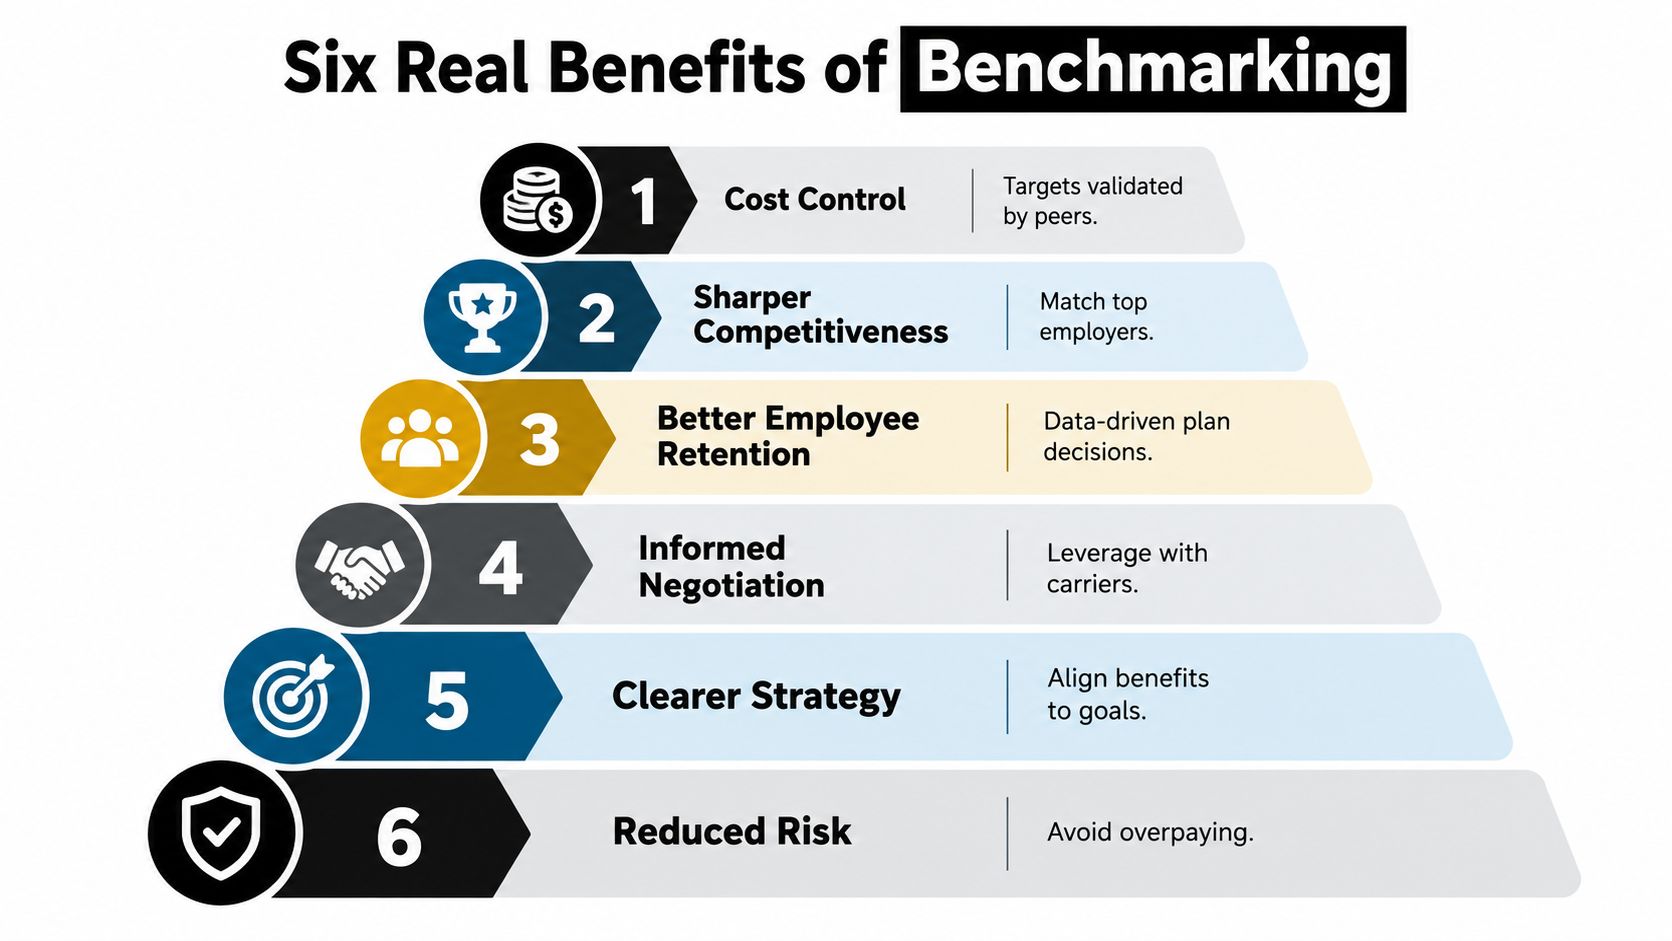
1. Cost control with peer-validated targets
A budget target is stronger when it reflects comparable employers rather than last year's spend. If your employer cost per enrolled employee sits above a matched peer group, leadership can investigate whether the difference comes from plan richness, contribution policy, network pricing, or claims risk.
2. Competitiveness against the employers you actually face
A national average isn't your labor market. Your relevant competitors may be local technology companies, regional manufacturers, professional-services firms, or venture-backed employers recruiting from the same talent pool. Benchmarking reveals whether your coverage is likely to look competitive to the people you need to hire and keep.
3. Better plan design
Premiums alone won't show whether your deductible strategy works. Compare contribution tiers, employee and dependent affordability, network access, out-of-pocket exposure, and enrollment behavior. A contribution redesign may improve affordability without adding the same cost across every coverage tier.
4. Stronger negotiations with carriers and PEOs
A carrier or PEO has more room to control the conversation when you only present an internal renewal history. A documented peer comparison gives your broker specific questions about underwriting, network pricing, plan richness, and alternative designs. It also helps you evaluate whether a proposed concession creates value or merely shifts cost.
5. Governance tied to workforce objectives
Benefits committees often approve changes because a renewal is due, not because the change supports a measurable objective. Gallagher's 2018 survey of 4,241 U.S. organizations found that 74% considered health benefits competitive in their industry, while only 44% agreed they had an effective strategy for managing benefit costs, as reported in the Gallagher benchmarking survey. Benchmarking makes the tradeoff visible.
6. A closed measurement cycle
A benchmark is useful only if someone acts on it and measures the result. Establish a baseline, change one or more program features, then review cost, affordability, participation, administration, and employee outcomes at agreed checkpoints.
See how these ideas can be applied in practice:
How to Run a Benchmarking Analysis Step by Step
A sound analysis has four stages. Skip one, and the result becomes either a generic market report or an internal spreadsheet with no decision value.
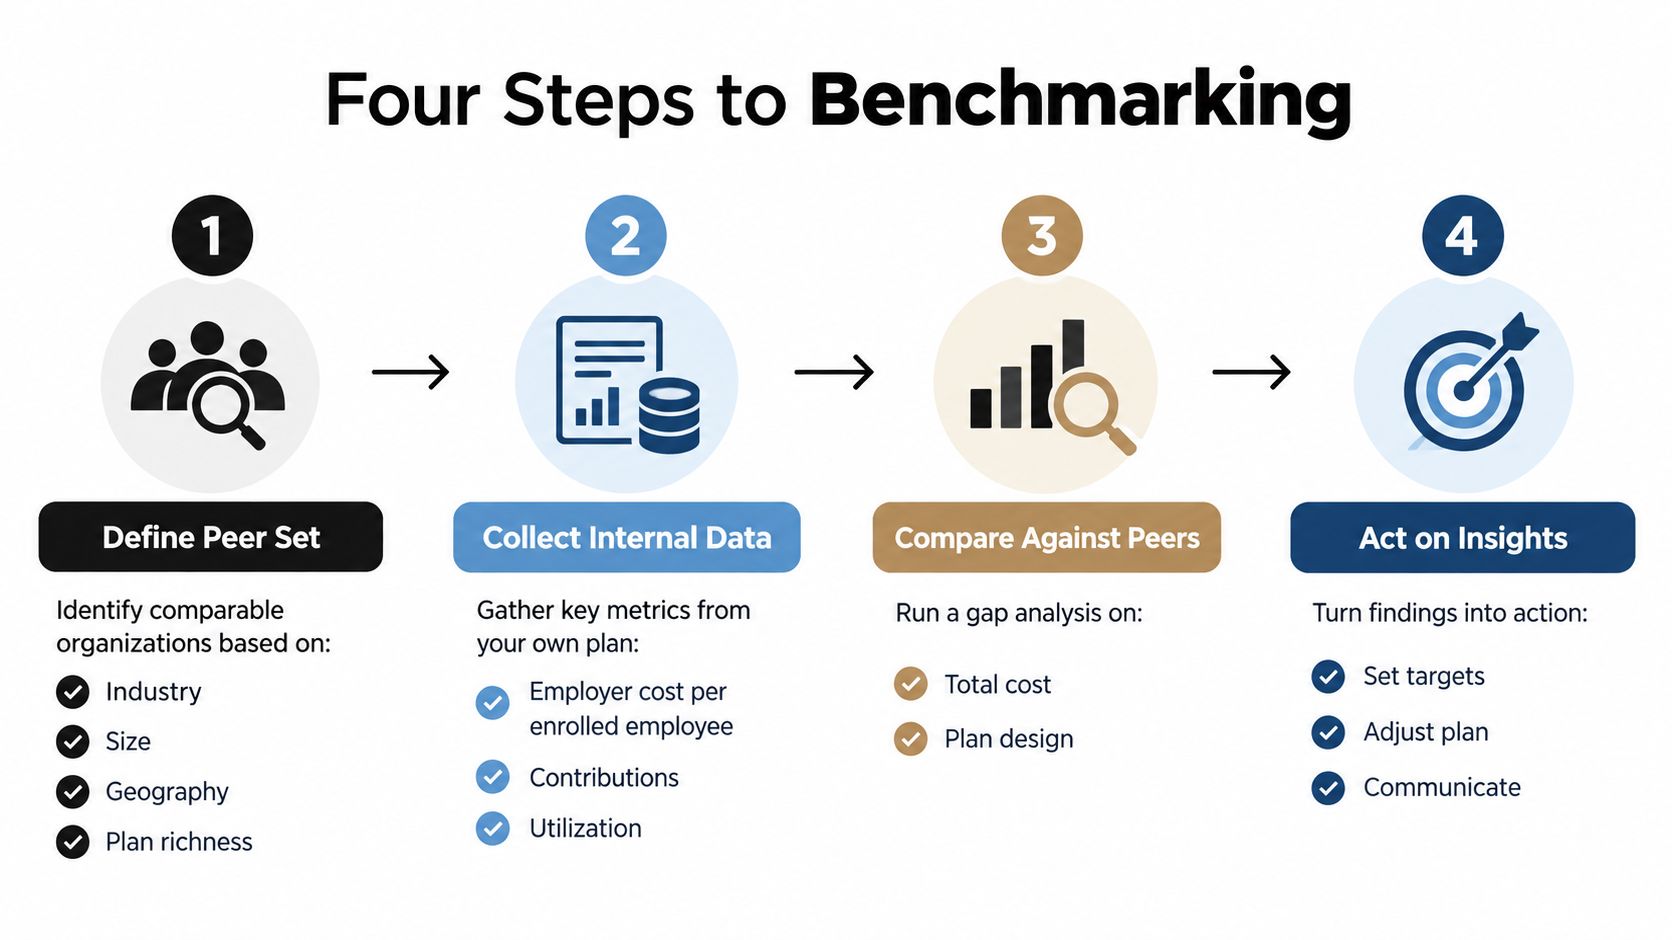
Define the peer set
Start with employers that resemble your organization. Match on company size, industry, geography, workforce composition, payroll structure, plan richness, and relevant risk characteristics. Don't compare a small regional employer with an enterprise whose buying power and workforce mix are different.
Set the questions before collecting data. Decide whether you're testing employer cost, employee affordability, competitiveness, administrative efficiency, retention support, or all of these.
Collect internal data
Build a baseline from your own records. At minimum, capture:
- Employer cost: Cost per enrolled employee and total employer spend.
- Employee burden: Payroll deductions, dependent contributions, and out-of-pocket exposure.
- Operations: Enrollment completion time, service tickets, manual work, and compliance workload.
- Program behavior: Enrollment, waivers, utilization indicators, and plan selection.
Your internal baseline should cover the period before any plan change. Without it, you can't distinguish an improvement from a favorable market movement.
Compare the right measures
Use current market references from organizations such as KFF, WTW, Gallagher, and broker reports, then adjust the comparison for differences in plan design and workforce risk. Sequoia's enterprise benchmarking data found that 73% of employers prioritized reducing overall healthcare costs while only 26% prioritized affordability, a gap described in Sequoia's enterprise benchmarking report. That contrast is a warning: cost reduction and affordability aren't interchangeable goals.
For employee input, use a structured employee benefits survey template to capture affordability concerns, plan preferences, and enrollment friction before selecting a response.
Act and monitor
Suppose your comparison shows that employees contribute materially more than similar employers for family coverage. You might redesign contribution tiers before open enrollment, then monitor payroll deductions, enrollment choices, waiver behavior, service volume, and employee feedback.
Most employers stop after producing the report. That's where the value disappears. Put the target, intervention, owner, review date, and success measure in writing. Revisit the results during open enrollment, after implementation, and at renewal.
When Benchmarking Misleads and How to Fix It
A raw average can give you the wrong answer with impressive confidence. A workforce with older employees, higher healthcare utilization, richer coverage, expensive provider contracts, or a small number of high-cost claimants may appear inefficient when the plan is serving a different risk profile.
WTW's 2025 survey found that 90% of U.S. employers identified rising benefit costs as a strategic influence, up from 67% in 2023, with 63% planning to rebalance spending, according to WTW's survey findings. Cost pressure makes bad comparisons more dangerous because leaders may act quickly on a misleading signal.
Normalize before you judge
Segment the comparison by:
- Geography: Account for local provider pricing and labor-market conditions.
- Plan design: Compare similar deductibles, networks, actuarial value, and covered services.
- Workforce risk: Consider age distribution, population health, utilization, and high-cost claimants.
- Contribution policy: Separate employer cost from employee cost and examine the combined burden.
- Operations: Match organizations with similar workforce size, payroll integration, and compliance requirements.
A single premium-per-employee figure is too blunt for a serious decision. Use normalized measures such as employer and employee contributions as a share of premium, actuarial value, network access, enrollment completion time, utilization indicators, and administrative workload.
Practical rule: Never label a plan inefficient until you can explain which structural difference the comparison has controlled.
The best benchmark doesn't tell you to copy the lowest-cost peer. It tells you which gap deserves attention. If the gap comes from richer coverage that employees value, preserve it and explain the cost. If it comes from weak contribution design or avoidable administrative friction, fix the actual cause.
Why Size and Industry Matter More Than the National Average
Large employers often buy differently from SMBs. They may have more negotiating power, broader geographic footprints, different risk distribution, and more administrative capacity. A national average that blends those organizations with small firms can make your plan look better or worse than it really is.
KFF's 2025 survey covered 1,862 employers with at least 10 workers. For family coverage, average worker contributions were $8,889 at firms with 10–199 employees, compared with $6,227 at larger firms, a difference of $2,662 per year, according to KFF's 2025 Employer Health Benefits Survey.
| Employer Size | Avg. Worker Annual Contribution | Difference vs. Larger Firms |
|---|---|---|
| Firms with 10–199 employees | $8,889 | $2,662 higher |
| Larger firms | $6,227 | Baseline |
What the comparison means
For an SMB, the relevant question isn't whether employees pay more than a national average. It's whether the contribution burden is reasonable for similarly sized employers competing for similar talent.
Use size-matched comparisons when setting the benefits budget. Then examine geography and industry before changing the plan. A professional-services employer in a high-cost city may need a different affordability strategy from a manufacturer operating in a lower-cost region.
Contribution design also deserves separate attention. If employees carry a higher burden because the company offers a deliberately generous dependent subsidy, that may be a rational choice. If the burden is high because the employer never revisited outdated tiers, benchmarking can identify a practical correction without reducing core coverage.
The right benchmark doesn't make your company look average. It helps you decide what your company can defend.
Turning Benchmark Data Into Decisions and Proof
Convert the report into a one-page scorecard with four quadrants:
- Employer cost: Total spend, cost per enrolled employee, and renewal movement.
- Employee affordability: Payroll deductions, dependent burden, and out-of-pocket exposure.
- Market competitiveness: Plan richness, network access, contribution structure, and peer position.
- Workforce outcomes: Enrollment completion, participation, retention indicators, service tickets, utilization, and sentiment.
Measure the baseline before changing anything. Then document the intervention, whether that means redesigned contribution tiers, a different carrier, an enrollment automation project, or a plan adjustment. Review results after implementation and at renewal, then record whether the change worked, partially worked, or created an unacceptable tradeoff.
A structured variance analysis guide can help finance and HR explain why actual costs differ from budget or benchmark expectations. For a broader view of HR total rewards, connect the benefits result to compensation, retention, and the employee experience rather than treating medical coverage as an isolated expense.
The next time the CFO asks about a renewal increase, you should be able to answer with the peer set, the normalized gap, the workforce objective, the proposed action, and the measurement plan.
Benely helps SMBs compare benefit options, set budgets, automate enrollment, and benchmark employer contributions, premiums, plan design, participation, and employee value in one connected process. Visit Benely to turn your next renewal from a pricing surprise into a documented benefits decision.