 Employee Benefits
 HR & Compliance
 Technology
 Wellness
 PEO Solutions
Employer benefits cost averaged $15.60 per hour worked in March 2026, or roughly 31.6% of total compensation. For SMB leaders, the job is understanding what creates that number and which decisions can lower the employer bill without pushing more cost onto employees.
That figure comes from the Bureau of Labor Statistics Employer Costs for Employee Compensation report, and it changes the conversation. Benefits aren't a minor add-on to payroll. They're a recurring labor expense that affects hiring budgets, renewal decisions, cash planning, and employee trust.
The visible bill is only part of the story. Employer premiums, retirement contributions, payroll taxes, and paid leave sit on the general ledger, while broker coordination, HR technology, compliance work, eligibility corrections, and reconciliation consume time in the background. A benefits strategy that ignores both sides gives leadership an incomplete cost picture.
Table of Contents
- What the Cost of Employee Benefits Really Means for Your Business
- The Major Cost Categories Inside Every Benefits Package
- 2025-2026 Benchmarks Every SMB Leader Should Know
- Three Ways to Calculate Your True Benefits Cost
- Why Benefits Cost Varies So Much by Company Size and Industry
- Smart Strategies to Control Costs Without Hurting Retention
- Your Next Steps and a Quick SMB Action Checklist
What the Cost of Employee Benefits Really Means for Your Business
The BLS reported that employer compensation costs averaged $49.32 per hour worked in March 2026, including $15.60 in benefit costs and $33.72 in wages and salaries. Benefits therefore represented about 31.6% of total compensation, while wages and salaries made up the balance, according to the same BLS compensation-cost data.
At a full-time schedule, that hourly benefit figure translates into roughly $32,500 per employee annually. That translation is useful for planning, but don't treat it as a quote for your company. Your actual cost depends on employee wages, enrollment, plan design, location, age mix, claims, contribution policy, and the benefits you offer.
Start with the employer-paid share
For budgeting purposes, define benefits cost as the amount the company pays across several categories:
- Insurance: Medical, dental, vision, life, disability, and other employer-funded coverage.
- Retirement: Employer matches, nonelective contributions, and related plan expenses.
- Payroll taxes: Social Security, Medicare, unemployment taxes, and other legally required items.
- Leave: Paid time off, parental leave, sick leave, and the wage cost of approved absences.
- Administration: Broker fees, software, compliance support, payroll coordination, and internal HR labor.
The employee contribution matters too, but it belongs in a separate view. If employees pay part of a medical premium through payroll deductions, that amount reduces the employer's direct premium expense, yet it still affects affordability, participation, morale, and retention.
Practical rule: Track employer cost and employee cost separately. Combining them hides who absorbs the next renewal increase.
Add the administrative drag
The benefits invoice won't show every hour your team spends fixing eligibility files, reconciling carrier bills, answering repetitive enrollment questions, or coordinating payroll changes. Those tasks still carry a cost. The same is true of disconnected systems that force HR to move data between spreadsheets, payroll, carriers, and enrollment tools.
Build a total compensation view with a total compensation statement resource so employees and leaders can see the full package in one place. For an SMB, that visibility supports better decisions because it separates the direct plan bill from the operational effort required to run it.
Your first benchmark should include three figures: employer benefits cost per employee, benefits cost as a percentage of payroll, and administrative effort connected to the program. Once those figures are visible, you can decide whether the problem is an expensive plan, weak participation, poor vendor coordination, or a combination of all three.
The Major Cost Categories Inside Every Benefits Package
Every benefits package contains several cost buckets, but they don't respond to the same pressures. Medical coverage reacts to premiums, utilization, provider prices, and pharmacy exposure. Retirement contributions follow payroll and participation. Paid leave follows workforce policy and absence patterns. Payroll taxes follow compensation and statutory rules.
The most important point is simple: don't apply one cost-control tactic to every category. A medical redesign won't fix payroll-tax expense, and changing a retirement match won't remove the administrative work created by multiple vendors.
Where the money generally flows
The following planning view uses broad category ranges from the requested benefits-cost framework. These aren't universal accounting ratios, so use your own payroll, invoice, and enrollment data before setting targets.
| Benefits Category | Approximate Share of Total Benefits Cost | Key Driver of Yearly Change |
|---|---|---|
| Health insurance, including medical, dental, and vision | Roughly 55% to 60% | Premium renewals, utilization, pharmacy, networks, and plan design |
| Retirement contributions plus Social Security and Medicare taxes | Near 30% combined | Payroll growth, contribution policy, participation, and statutory costs |
| Paid leave, including PTO and parental leave | Around 10% | Headcount, wages, policy design, and employee usage |
| Ancillary benefits, wellness, and commuter programs | Remaining share | Enrollment, vendor pricing, program adoption, and policy changes |
Health insurance usually deserves the first review because it combines the largest visible premium with the most complicated utilization pattern. Medical, dental, and vision should be analyzed separately where possible. A dental plan with predictable utilization behaves differently from medical coverage affected by specialty drugs or high-cost treatment.
Employees also need clear explanations of what coverage pays for. A plain-language guide to insurance for psychiatry visits can help illustrate why benefit value depends on deductibles, copays, networks, and coverage rules, not just the premium printed on the enrollment form.
Separate required costs from voluntary benefits
Legally required items, including Social Security, Medicare, and unemployment taxes, can outweigh some voluntary offerings in dollar terms. You can't negotiate those costs away, but you can forecast them accurately by modeling payroll and headcount.
Retirement contributions are more controllable, though contribution changes affect recruiting and retention. Paid leave is partly a policy decision and partly a staffing issue. An overly restrictive policy may reduce direct leave expense while increasing dissatisfaction or forcing employees to work through health and family needs.
Ancillary benefits deserve an audit rather than automatic cancellation. Life and disability coverage may support financial security, while wellness stipends, commuter benefits, and employee assistance programs can either add value or create clutter if nobody understands them. A clear ancillary benefit definition helps teams distinguish supplemental coverage from core medical spending before they compare vendors.
2025-2026 Benchmarks Every SMB Leader Should Know
Benchmarks are useful only when they change a decision. Don't collect national figures to decorate a board deck. Use them to test whether your renewal assumptions, employee contribution strategy, and plan design are realistic.
The strongest 2025-2026 reference point is employer-sponsored family coverage. The Kaiser Family Foundation 2025 Employer Health Benefits Survey reports average annual family premiums of $26,993, with workers contributing $6,850 and employers paying the remainder. That structure places roughly three-quarters of the family premium on the employer, so a premium increase can materially affect total benefits spend even when headcount doesn't change.
Benchmark the split, not just the premium
BLS data for March 2025 shows that employers paid 80% of single-coverage premiums in private industry and 69% of family-coverage premiums, with employees paying the remaining shares. The BLS premium-share tables make the distinction clear: family coverage typically creates a larger employee dollar obligation even when the employer still pays most of the premium.
Participation adds another layer. BLS defines the take-up rate as the percentage of workers with access to a plan who participate, as explained in its employee benefits publication. Access, eligibility, and enrollment aren't interchangeable. Your budget should model each one.
| Benchmark Metric | 2025-2026 Value | Source | Implication for SMB Budgets |
|---|---|---|---|
| Employer compensation cost | $49.32 per hour, including $15.60 in benefits, March 2026 | BLS ECEC report | Treat benefits as a core labor-cost category |
| Family premium | $26,993 annually in 2025 | KFF 2025 survey | Model employer and employee shares separately |
| Worker family contribution | $6,850 annually in 2025 | KFF 2025 survey | Test affordability and retention impact |
| Projected total health-benefit cost increase | 6.5% to 6.7% for 2026 | Benefitfocus 2026 report | Build a scenario range before renewal |
| Projected health benefit cost per employee | $17,496 in 2025, projected to rise 6.7% in 2026 | Mercer cost summary | Review plan design before accepting the renewal |
Mercer also reports that, without plan changes, the average increase would be nearly 9%, according to the 2026 benefits-cost discussion. That matters because a lower employer invoice may reflect cost shifting rather than a lower total cost. Before choosing a higher deductible or narrower network, calculate the impact on both parties.
For growing SMBs, self-funded or level-funded arrangements may become worth evaluating, but don't assume they automatically save money. Compare expected claims exposure, stop-loss terms, administrative fees, cash-flow requirements, and renewal protection against the fully insured alternative.
Three Ways to Calculate Your True Benefits Cost
Finance teams often say “benefits cost” while HR teams mean something different. A founder may think in annual dollars per employee, a broker may focus on cost as a percentage of payroll, and the BLS may frame benefits as a percentage of total compensation. All three are valid. They answer different questions.
Use the metric that fits the decision
Cost per employee per year is the clearest operating measure. Divide total annual employer benefits expense by average employee count. It works well for comparing headcount plans, forecasting hiring, and setting a budget target.
Benefits as a percentage of payroll shows how benefits move alongside wages. Divide annual employer benefits expense by total payroll. Brokers and carriers often use this lens during renewals because a higher-paid workforce can produce a larger benefits bill even when enrollment is stable.
Benefits as a percentage of total compensation puts the expense in the same frame used by the BLS. Divide benefits cost by wages and salaries plus benefits. The March 2026 BLS data placed benefits at about 31.6% of total compensation in its employer-cost measure, as documented in the BLS ECEC report.
Worked example for a 25-person firm
Assume a company has 25 employees, an average salary of $80,000, and $310,000 in employer benefits. The arithmetic produces three different management views:
- Per employee: $310,000 divided by 25 equals $12,400 per employee.
- Percent of payroll: $310,000 divided by $2,000,000 in payroll equals 15.5%.
- Percent of total compensation: $310,000 divided by $2,310,000 in wages plus benefits equals 13.4%.
| Method | Formula | Worked Example, 25 Employees | Best Used For |
|---|---|---|---|
| Cost per employee | Total benefits cost ÷ employees | $310,000 ÷ 25 = $12,400 | Headcount planning and peer comparisons |
| Percent of payroll | Benefits cost ÷ total payroll | $310,000 ÷ $2,000,000 = 15.5% | Renewal and payroll budgeting |
| Percent of total compensation | Benefits cost ÷ wages plus benefits | $310,000 ÷ $2,310,000 = 13.4% | Executive and board-level compensation analysis |
Lead board updates with percent of total compensation because it shows the labor-cost relationship. Lead budget reviews with cost per employee because hiring managers can understand the impact immediately. Use payroll percentage during renewal negotiations, but never let one metric replace the other two.
Why Benefits Cost Varies So Much by Company Size and Industry
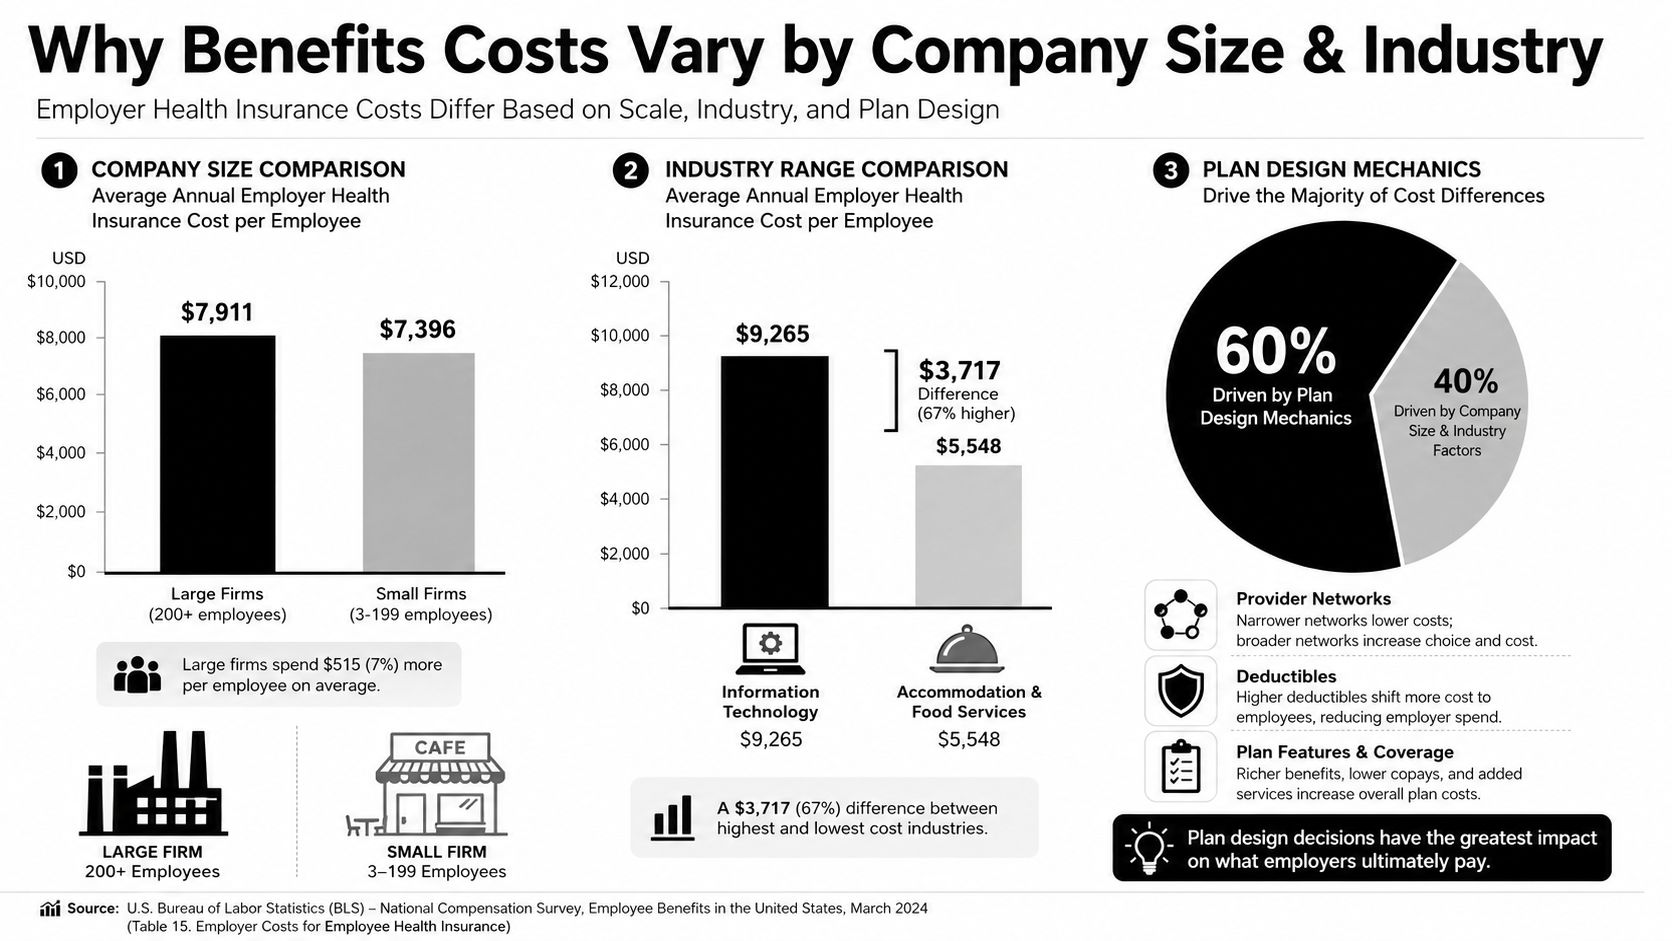
Two employers with the same headcount can receive very different benefits quotes. The reason isn't always broker performance. Carriers evaluate the enrolled population, location, plan design, provider pricing, claims experience, contribution rules, and participation pattern.
Industry mix matters because employees in different workforces use healthcare differently. A construction company may have a different age distribution, occupational exposure, and gender mix than a technology company. A hospitality employer may face a different wage structure and enrollment pattern than a professional-services firm. Those differences affect both the expected claims profile and the employer's payroll-tax exposure.
Read sector data carefully
BLS data for March 2025 shows benefits averaged $13.58 per hour worked, or 29.8% of total compensation, for private-industry workers. State and local government workers averaged $24.63 per hour, with benefits representing 38.5% of compensation, according to the BLS sector comparison.
That gap doesn't mean a public employer and a private employer with the same employee count should have comparable costs. Government plans may include different retirement structures, leave policies, and coverage commitments. Sector comparisons are context, not a quote for your renewal.
Identify the mechanics behind your quote
Small-group carriers often price risk differently from large-group carriers. A smaller enrollment pool gives the carrier less opportunity to spread claims volatility across a broad population. As a company grows, it may gain access to more plan structures, but larger scale doesn't eliminate risk or guarantee a lower bill.
Ask your broker to isolate the effect of:
- Network choice: Regional provider prices and network discounts can materially alter premiums.
- Deductibles and copays: Lower employee cost sharing generally requires a richer plan contribution.
- Geography: Employees in high-cost provider markets can produce different rates than employees elsewhere.
- Workforce composition: Age, family enrollment, wages, and participation change the cost profile.
- Multi-state operations: Different state rules and carrier availability can complicate administration.
- Legacy obligations: Defined-benefit pension commitments can create costs that don't appear in a standard medical comparison.
Don't compare your quote with a neighboring company until you know whether you're comparing the same coverage, contribution strategy, and workforce profile.
Smart Strategies to Control Costs Without Hurting Retention
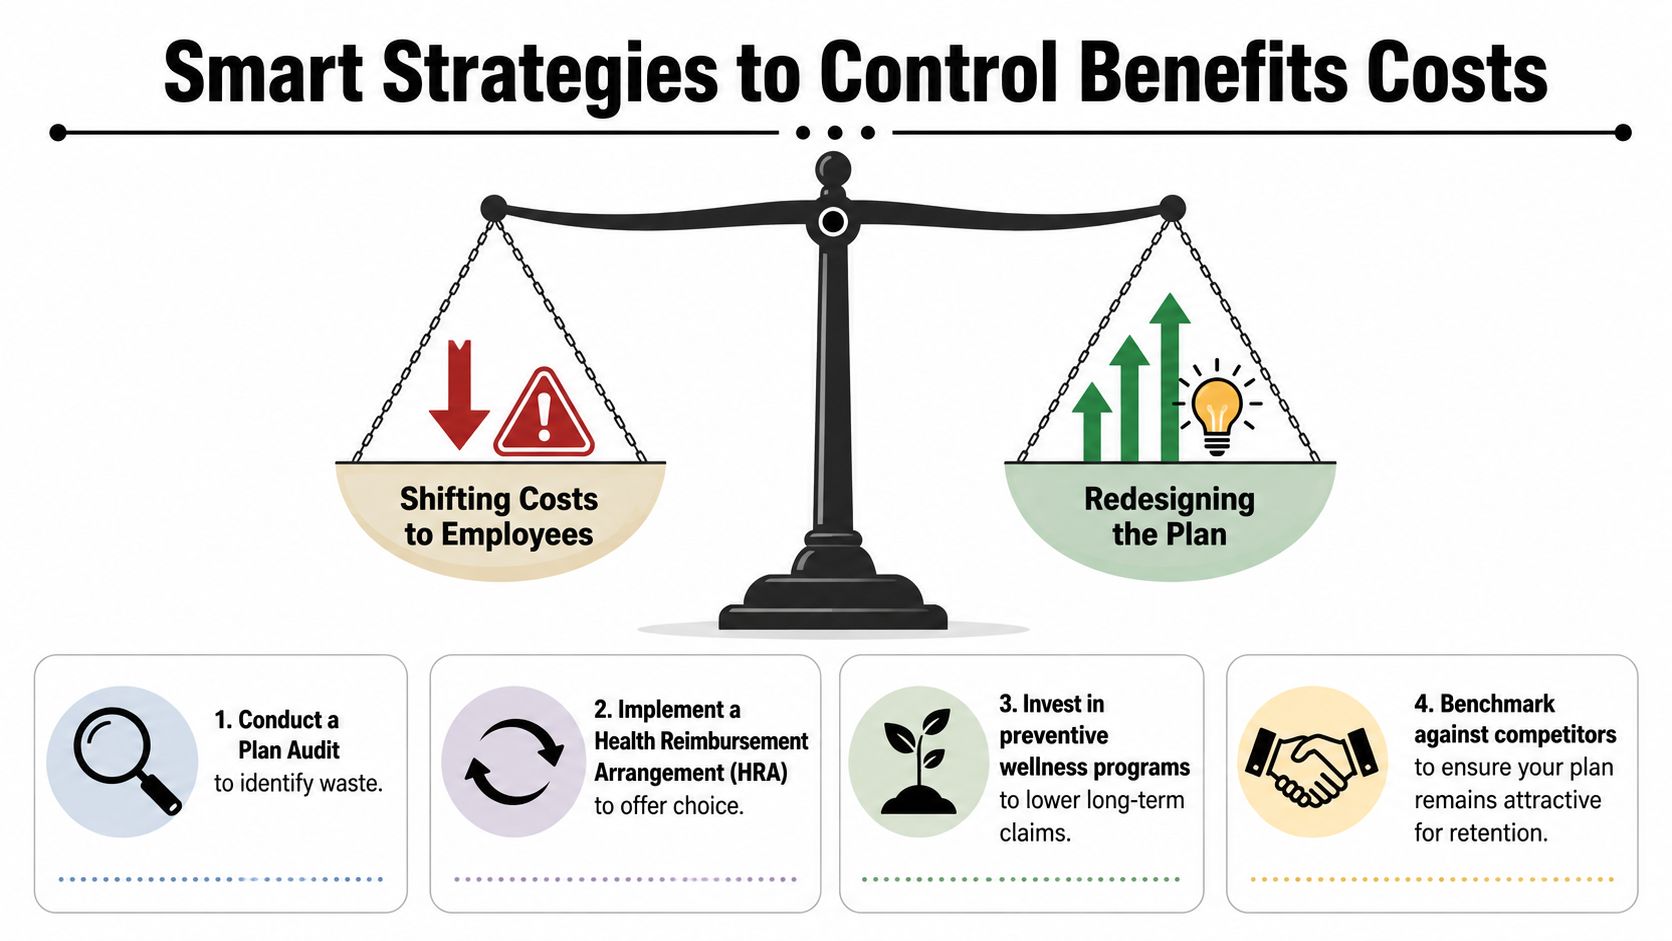
The easiest cost-control move is shifting more expense to employees. It requires little creativity, but it can damage affordability and make recruiting harder. If the employer saves money only because employees pay more, the business hasn't necessarily reduced total cost. It has redistributed it.
SMB leaders should start with plan design and operational discipline. Those levers can bend the employer trend without making the benefit package look punitive.
Make the plan do more work
A plan audit should identify duplicate vendors, unused programs, weak communication, billing errors, and coverage that doesn't match your workforce. Replace assumptions with enrollment and utilization data.
An HRA can offer employees choice while giving the employer a defined budget, but the design must fit eligibility rules and the company's compliance requirements. Level-funded or captive arrangements can also provide more predictable budgeting for some employers, although they require careful review of claims risk, stop-loss coverage, and administrative terms.
High-deductible health plans paired with HSA contributions are another option. They can reduce premiums, but don't present them as a universal solution. Employees may experience higher point-of-care exposure, and an employer contribution must be large enough to make the design workable for the workforce.
Negotiate with evidence
Bring carrier-level renewal information, enrollment data, claims summaries where available, and competitor benchmarks to the broker conversation. Ask for a side-by-side comparison that shows employer cost, employee payroll deductions, deductible exposure, out-of-pocket limits, network changes, and pharmacy provisions.
Cost shifting is not the same as cost control. The winning redesign lowers waste or volatility while keeping the employee experience credible.
Modern leave policies and voluntary benefits can improve perceived value without carrying the same cost as richer medical coverage. Consolidating vendors onto a connected benefits platform can also reduce duplicate data entry and reconciliation work. Teams trying to fix operational drag that affects staff retention should treat benefits administration as part of the employee experience, not just a back-office task.
Use this video as a practical prompt for reviewing plan design and benefits strategy:
The best recommendation is the one you can explain clearly to employees. If leadership can't describe why a change improves value, employees will interpret it as a cut.
Your Next Steps and a Quick SMB Action Checklist
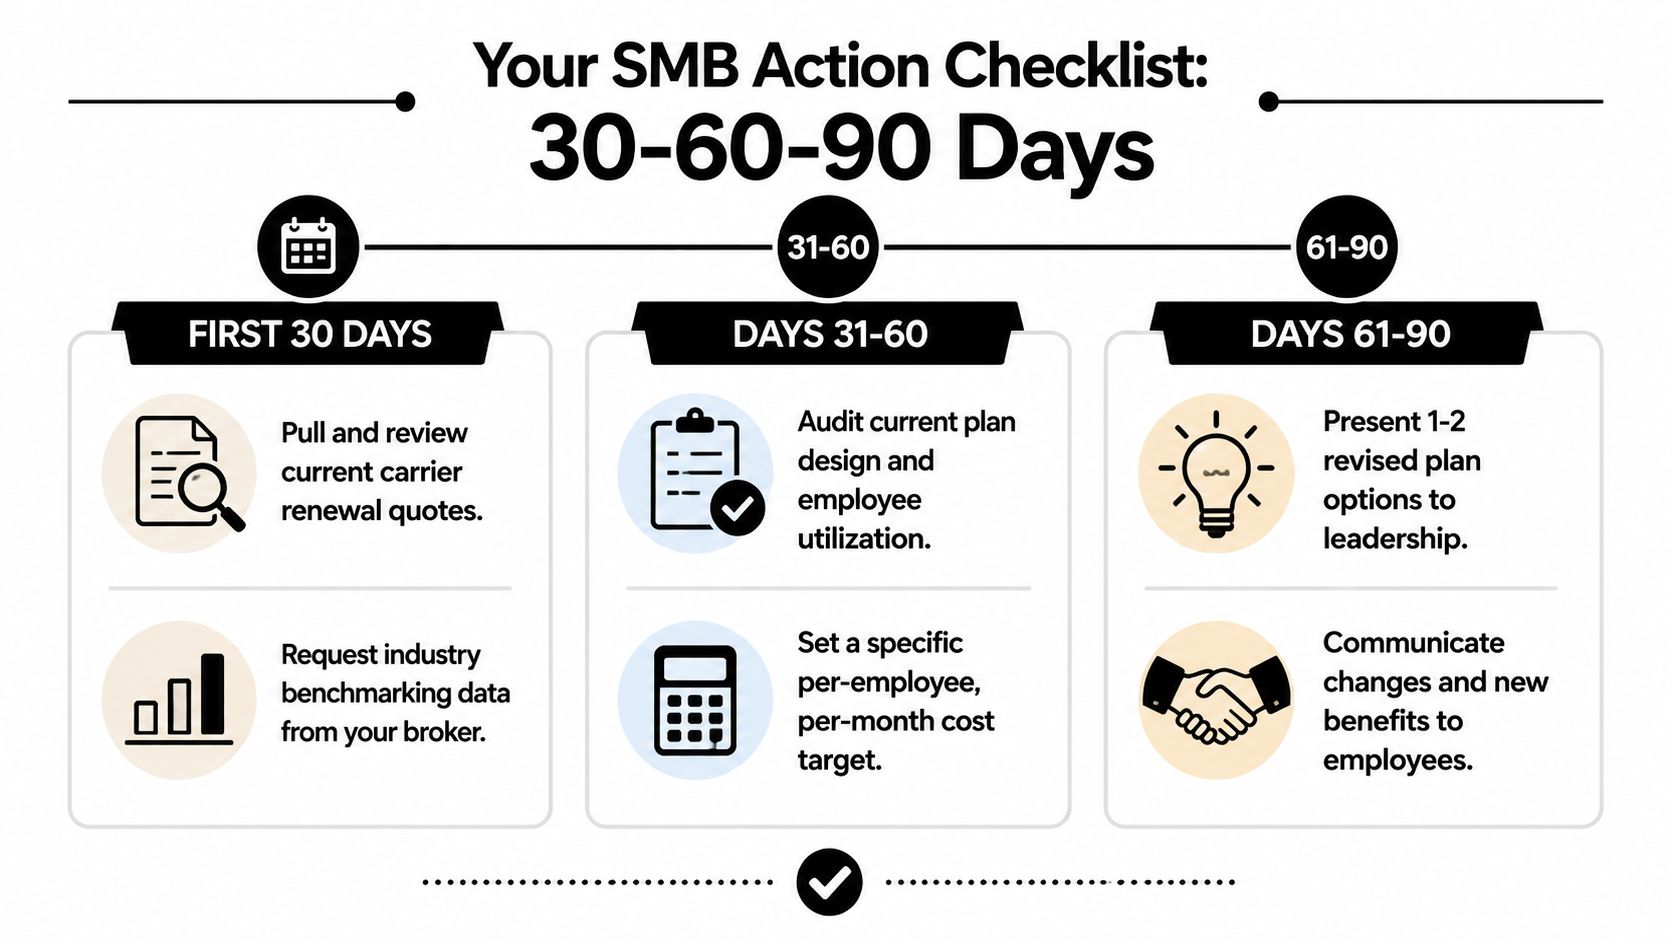
Don't wait for renewal season to discover that your benefits budget has no owner. Assign one person from finance, one from HR, and one executive sponsor to review the same data and approve a target.
First 30 days
- Pull renewal documents: Collect current carrier invoices, renewal quotes, contribution schedules, and enrollment files.
- Request benchmarks: Ask your broker for comparisons by company size, industry, geography, plan richness, and employer contribution.
- Separate the bill: Identify employer premiums, employee deductions, payroll taxes, retirement costs, leave costs, vendor fees, and internal administration.
Days 31 to 60
- Audit plan design: Review deductibles, networks, pharmacy rules, HSA or HRA options, participation, and employee affordability.
- Set a target: Choose a specific per-employee budget and a maximum acceptable employee contribution.
- Model alternatives: Compare the current plan with one or two redesigned options, showing employer cost and employee exposure side by side.
Days 61 to 90
- Present clear choices: Give leadership a short recommendation with tradeoffs, not a catalog of every available plan.
- Prepare communication: Explain what changes, why it changes, and how employees can use the coverage effectively.
- Track the result: Measure enrollment, take-up, employee questions, billing corrections, and total cost after implementation.
The next 18 months will put pressure on three areas: GLP-1 coverage, specialty pharmacy spending, and mental health parity enforcement. SHRM's 2026 survey added GLP-1 coverage as a specific topic, showing that employers need to price high-cost weight-management and diabetes drugs into strategy rather than treating pharmacy as a minor line item. Rising benefit costs are also influencing strategy globally, and Mercer reports that more employers are shifting costs to employees than in recent years, as summarized by Hooray Insurance's benefits trends coverage.
Review those exposures early. A budget that ignores volatile pharmacy categories can break at renewal, while a plan that responds only by tightening access can create downstream recruitment and morale problems.
Benely helps SMBs benchmark benefits costs, model employer and employee contributions, compare plan options, automate enrollment, and connect benefits administration with payroll and compliance workflows. Visit Benely to request a practical benefits-cost comparison and build a renewal strategy around the number that matters, your true cost per employee.