 Employee Benefits
 HR & Compliance
 Technology
 Wellness
 PEO Solutions
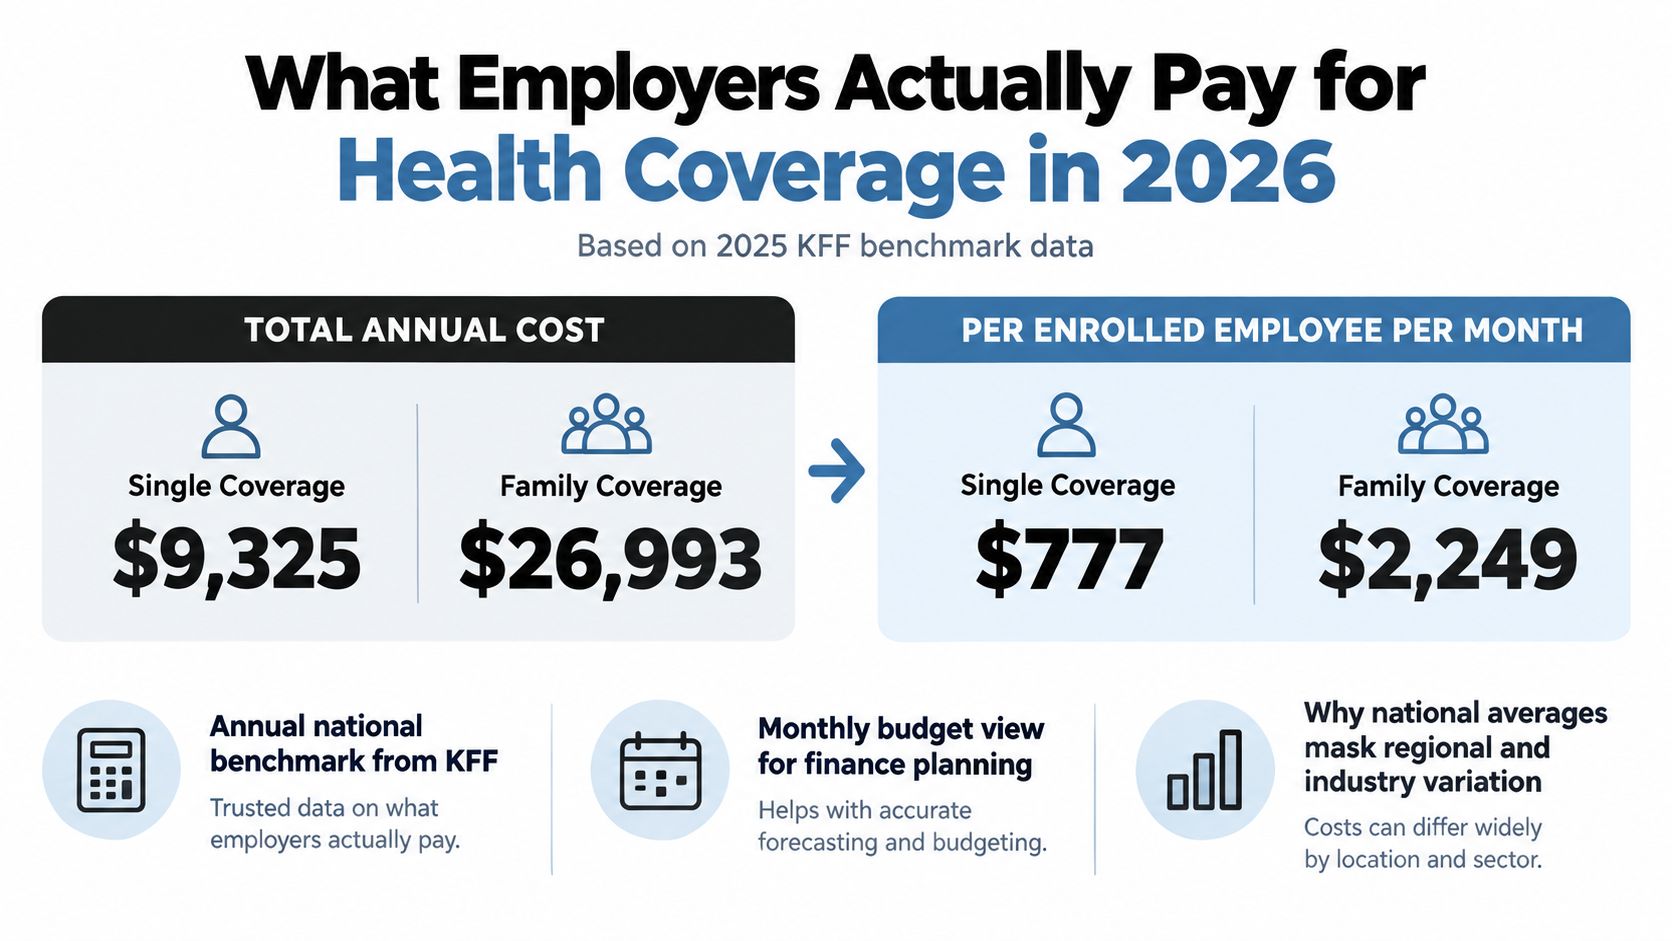
$9,325 per year for single coverage and $26,993 for family coverage was the 2025 average total premium for employer-sponsored health insurance, with employers paying roughly 85% of single premiums and 75% of family premiums. That works out to about $777 per month for single coverage and $2,249 for family coverage before deductibles, copayments, coinsurance, and out-of-pocket limits.
That's the number many founders find after a quick search, then discover it doesn't tell them what their company should budget. A 15-person startup with several families, a 50-person technology company, and a 150-person manufacturer can receive very different quotes even when each uses the same national benchmark.
The practical question isn't just, “How much does employee health insurance cost?” It's how much will each enrolled employee cost my company every month, under this plan, in this location, with this contribution policy? That's the number a CFO can defend to a board, founder, or finance team.
Table of Contents
- What Employers Actually Pay for Health Coverage in 2026
- The Employer vs Employee Share and How to Read a Premium
- The Five Cost Drivers That Move Your Premium Above or Below Average
- Modeling Three Small and Mid-Size Group Budgets
- Proven Strategies to Reduce Employer Health Insurance Spend
- The Small Business Health Care Tax Credit and Other Hidden Offsets
What Employers Actually Pay for Health Coverage in 2026
The 2025 KFF Employer Health Benefits Survey puts the average total premium at $9,325 annually for single coverage and $26,993 for family coverage. Converted into a monthly budgeting view, that's approximately $777 per enrolled employee with single coverage and $2,249 per enrolled family.
Those are total premiums, not the amount the employer necessarily pays. They combine the employer contribution and the employee's payroll deduction. For budgeting, start with the full premium, then calculate the employer share based on your contribution rules.
Use PMPM before you use headcount
PMPM means per member per month. It forces your budget to follow enrollment rather than payroll headcount. If 50 employees work for your company but only 38 enroll, the premium budget is driven by those 38 enrolled employees and their coverage tiers.
Build the model in this order:
- Count enrolled employees, not just eligible employees.
- Separate single and family enrollment.
- Select the plan benchmark, such as PPO or a high-deductible health plan with a savings option.
- Apply the employer contribution rule to each tier.
- Add renewal, administrative, and compliance assumptions only after the premium baseline is clear.
A second useful lens is health benefits as a percentage of payroll. PMPM tells you the direct premium burden. Percent-of-payroll tells you whether the benefit remains affordable relative to compensation. Use both. A plan can look manageable on a PMPM basis while consuming too much of the compensation budget, especially when family enrollment is concentrated among higher-paid employees.
National averages are a starting line, not a quote. KFF's 2025 survey changed its sample to employers with at least 10 workers, which makes the benchmark less directly representative of the smallest businesses. Your actual number depends on plan design, geography, workforce demographics, carrier network, and contribution strategy. The definition of employer-sponsored health coverage also matters because a traditional group plan and an individual coverage reimbursement strategy create different budgeting mechanics.
A 50-person company staring at a broker quote shouldn't ask whether the quote matches the national average. It should translate the quote into enrolled lives, coverage tiers, employer PMPM, and annual cash cost, then test what happens if family enrollment or plan selection changes.
The Employer vs Employee Share and How to Read a Premium
A premium has three separate figures, and finance teams often mix them together:
- Total premium: The full annual price of coverage.
- Employee contribution: The amount deducted from the worker's paycheck.
- Employer share: The portion paid by the company.
For 2025, employees contributed an average of $1,440 annually for single coverage and $6,850 for family coverage, according to KFF's 2025 employer benefits findings. The employer therefore paid approximately $7,885 for single coverage and $20,143 for family coverage on average. The actual split varies by company size, plan design, and workforce.
Monthly, the benchmark looks like this:
| Coverage tier | Total premium per month | Employee contribution per month | Employer share per month |
|---|---|---|---|
| Single | About $777 | About $120 | About $657 |
| Family | About $2,249 | About $571 | About $1,679 |
The monthly figures are calculated from the annual amounts, so finance teams can place them directly into a benefits workbook. They're also more useful than an annual average when you're comparing carrier proposals or modeling a midyear hiring plan.
A 50-person example
Assume a 50-person company has 35 employees enrolled in single coverage and 15 enrolled in family coverage. Using the national total-premium benchmark, the annual premium would be approximately:
- Single coverage: 35 × $9,325 = $326,375
- Family coverage: 15 × $26,993 = $404,895
- Total annual premium: $731,270
Using the average employer shares, the company's approximate annual contribution would be:
- Single employer share: 35 × $7,885 = $275,975
- Family employer share: 15 × $20,143 = $302,145
- Total employer spend: $578,120
The remaining amount, approximately $153,150, would come from employee payroll deductions. The company's employer premium budget in this example averages about $964 per enrolled member per month, while the full premium averages about $1,219 per enrolled member per month.
That difference is why a benefits budget must show both employer spend and employee cost. A lower company contribution may improve the budget while making recruitment and retention harder. A plan with higher deductibles can lower premiums but increase financial exposure when employees use care. Finance should review premiums alongside coinsurance and deductibles, not in isolation.
The same discipline applies to specialized benefits. For example, an employer comparing coverage questions for birth workers can review compare doula insurance options separately from the medical plan. Keep each benefit category in its own budget line so the medical premium doesn't become a catch-all number.
The Five Cost Drivers That Move Your Premium Above or Below Average
A national average hides the levers that determine your quote. Some are controllable, some are market conditions, and some are characteristics of your workforce that you can't quickly change.
Plan design
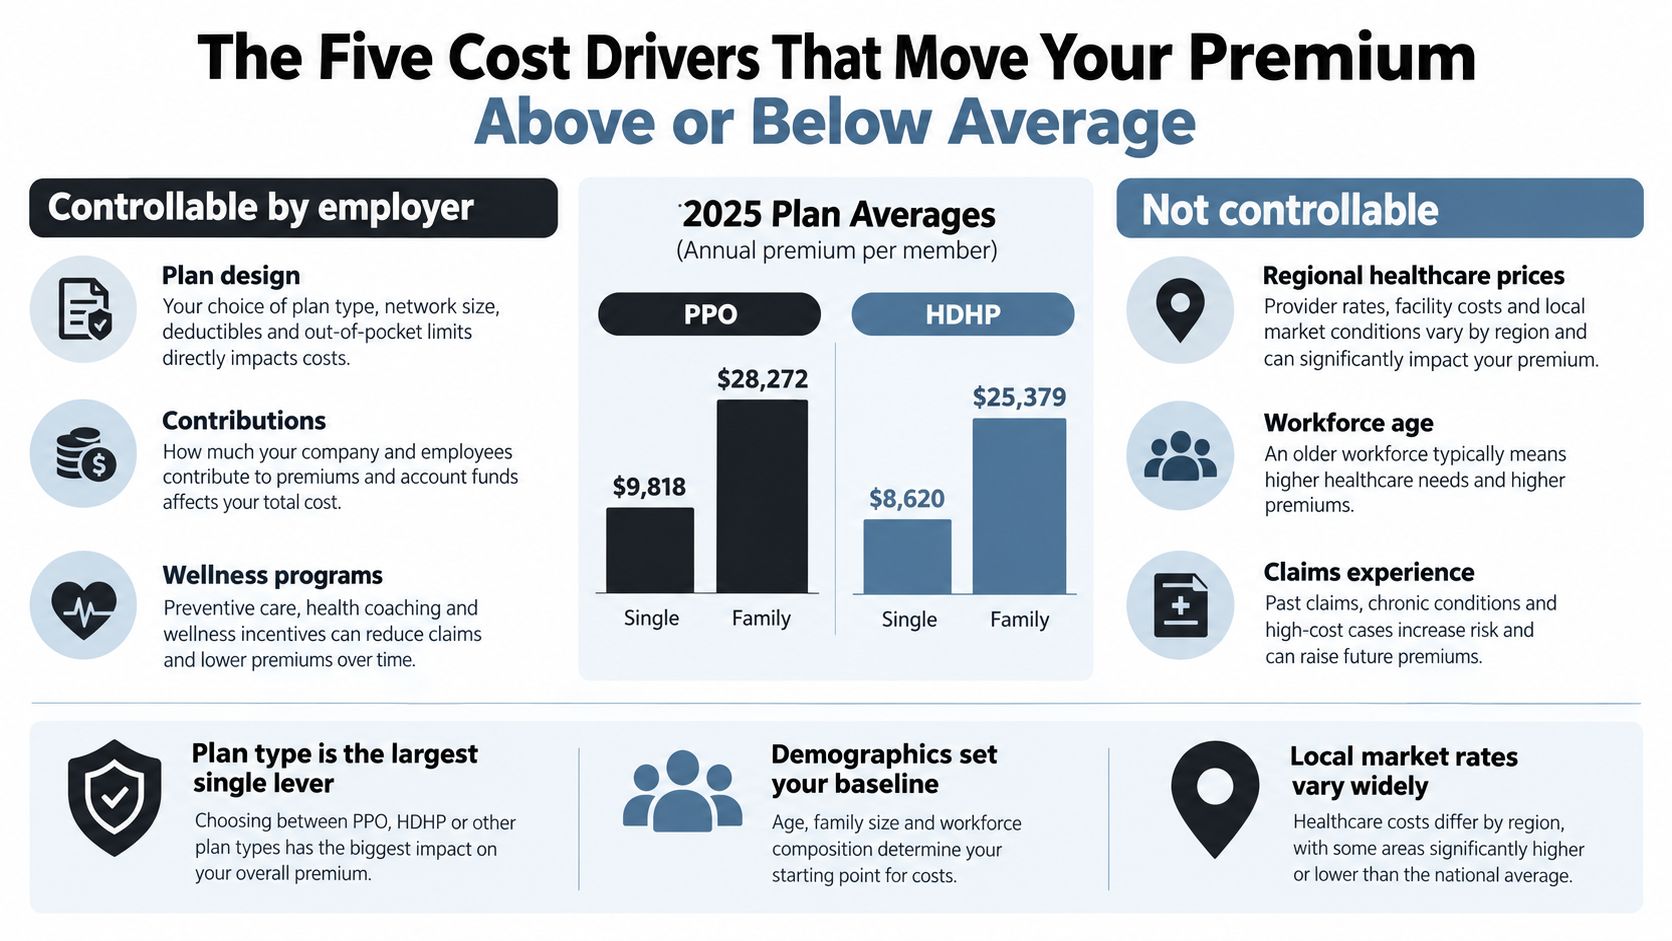
Plan type creates a visible difference. In 2025, PPO premiums averaged $9,818 for single coverage and $28,272 for family coverage, compared with $8,620 and $25,379 for high-deductible plans paired with savings options, according to KFF's plan-type comparison.
That's a meaningful premium gap, but it isn't free savings. An HDHP generally shifts more cost exposure to the employee through the deductible and other point-of-care expenses. An HMO or POS plan may reduce premiums through a narrower or more structured network. A PPO may cost more while offering broader provider access. Compare premium, deductible, coinsurance, out-of-pocket limit, and prescription coverage as one package.
Geography
Location can move the baseline before you make any contribution decision. California's 2025 averages were $10,033 for single coverage and $28,397 for family coverage, above the national averages of $9,325 and $26,993. Local provider prices, carrier competition, and network availability all influence the quote.
Workforce composition
Age mix, family enrollment, industry, and claims experience affect the risk pool. A company with mostly single employees may have a lower total premium budget than a similarly sized company with substantial dependent enrollment. The coverage tier matters as much as the employee count.
Carrier and network
Two carriers can price the same workforce differently because their contracted providers, utilization patterns, and local network strength differ. A narrow network may lower the premium but frustrate employees who rely on a particular hospital or specialist. Ask the broker to show network disruption, not just the rate.
Contribution policy
The company might pay the full employee-only premium while contributing a fixed amount toward dependents. It might use a percentage split, a tiered contribution, or a defined monthly allowance. Each approach changes employer spend and employee affordability.
Practical rule: Control plan design and contribution architecture first. Don't treat the national average as a target until you know which population and plan structure produced it.
Modeling Three Small and Mid-Size Group Budgets
The cleanest model separates group size, enrollment, plan type, and contribution policy. The scenarios below use the verified national benchmarks and stated assumptions. They're illustrations for planning, not quotes for an individual company.
| Group size | Plan type | Family enrolled | Annual total premium | Employer share | PMPM |
|---|---|---|---|---|---|
| 15 employees | National benchmark mix | 5 family, 10 single | $228,755 | $179,585 | About $1,270 |
| 50 employees | National benchmark mix | 15 family, 35 single | $731,270 | $578,120 | About $1,219 |
| 150 employees | National benchmark mix | 45 family, 105 single | $2,193,810 | $1,734,360 | About $1,219 |
The 15-person startup
This model assumes 10 single enrollees and 5 family enrollees. The total premium is $228,755 annually, with an approximate employer share of $179,585. The five family enrollments create a much larger budget burden than the ten single enrollments, even though they represent fewer people.
For a small startup, owner decisions dominate. A single hire who enrolls a spouse or children can materially change the monthly budget. Set the contribution policy before open enrollment and show employees the payroll impact clearly. If the company can't sustain an open-ended family subsidy, pay a defined employee-only amount and state how dependent coverage is handled.
The 50-person growth company
The 50-person model assumes 35 single and 15 family enrollments. It produces a total annual premium of $731,270 and an employer share of $578,120. The employer premium averages approximately $964 per enrolled member per month, while the total premium averages approximately $1,219 per enrolled member per month.
This is the point where a spreadsheet should replace intuition. Test the budget under different family enrollment assumptions, PPO versus HDHP selection, and contribution tiers. A one-line headcount estimate won't show the exposure.
The 150-person established group
The 150-person scenario uses 105 single and 45 family enrollments, producing a total premium of $2,193,810 and an employer share of $1,734,360. At this scale, the company can evaluate more than a single fully insured renewal. Self-funding, level-funded arrangements, richer plan choice, and stronger claims reporting become practical subjects for broker analysis.
Scale doesn't guarantee lower cost. It gives the employer more options and a larger population over which to evaluate volatility. Request a comparison that preserves employee access and shows the downside if claims run higher than expected.
Proven Strategies to Reduce Employer Health Insurance Spend
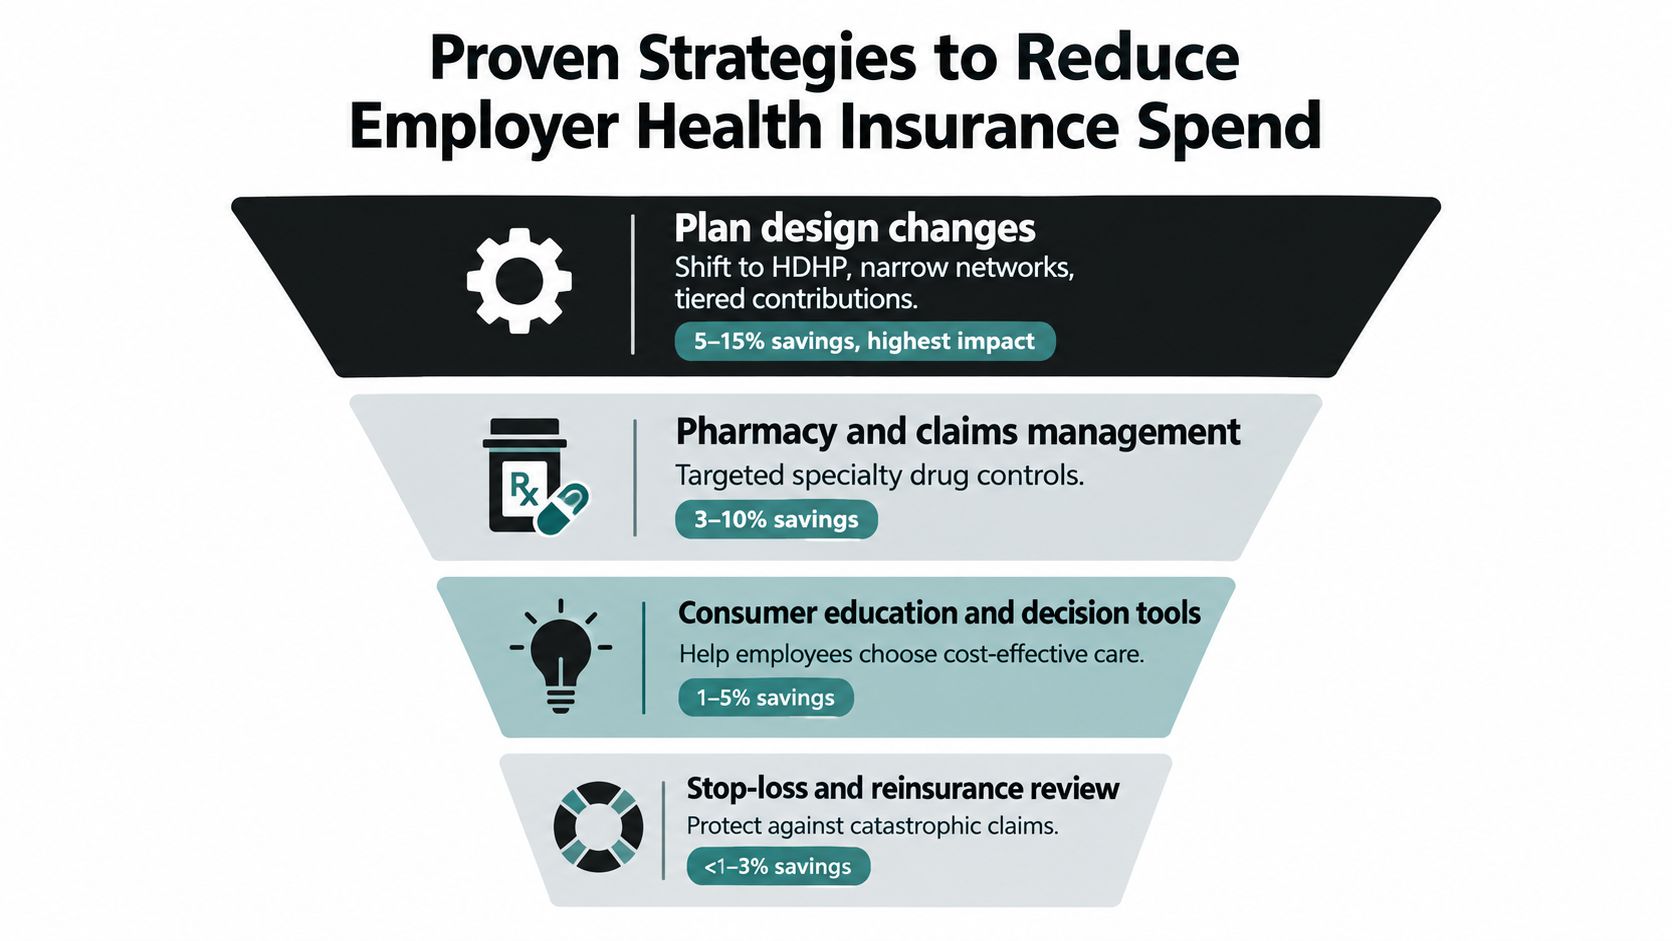
Not every cost-control idea reduces total spend. Some just move the bill from the employer's budget to the employee's paycheck or point-of-care exposure. Rank the levers by whether they reduce the premium, improve purchasing power, or merely change who pays.
First, change plan design carefully
Moving part of the population to an HDHP, narrowing networks, or using tiered contributions can create meaningful premium savings. The trade-off is employee friction. A narrower network may exclude a trusted provider, while a higher deductible can make care feel unaffordable.
Use plan design where the workforce can understand the change. Pair an HDHP with clear education, savings-account support where applicable, and a comparison of likely employee exposure. Don't call cost shifting savings if the company just transfers the same burden to workers.
Second, use scale when the group can support it
At larger enrollment levels, self-funded and level-funded arrangements deserve a serious review. Self-funding gives the employer greater claims visibility and the opportunity to retain favorable claims experience, but it also exposes the company to claims volatility. Level funding can provide a fixed payment structure with stop-loss protection, though the economics depend on underwriting, fees, claims, and renewal terms.
A 150-person employer has a stronger case for this analysis than a small group with concentrated enrollment. It still needs a downside model, not just an optimistic quote.
Third, test PEO economics
A PEO may offer pooled purchasing, administrative support, payroll connectivity, and access to benefit options that a small company couldn't negotiate alone. The trade-off is a per-employee fee and a co-employment structure. Compare the full cost, including service fees, compliance support, flexibility, and exit terms.
Fourth, make the broker prove the market
Ask for multi-carrier benchmarking and a side-by-side plan comparison. The broker should show the employer premium, employee payroll deduction, deductible, out-of-pocket limit, network differences, and renewal assumptions. A cheaper premium with a materially worse network is not automatically a better offer.
Fifth, treat wellness as a workforce strategy
Wellness programs may support retention, engagement, and absenteeism goals, but they usually aren't the first lever for immediate premium reduction. Put them below plan design, carrier competition, contribution structure, and claims management when the objective is near-term budget control.
Employers can also review health insurance cost for employers alongside broader benefits administration costs. The budget should capture the work required to enroll, reconcile payroll, handle qualifying events, and maintain compliance.
The Small Business Health Care Tax Credit and Other Hidden Offsets
The federal Small Business Health Care Tax Credit can cover up to 50% of eligible premium costs for qualifying small-business employers and up to 35% for eligible tax-exempt employers, according to the CMS Small Business Health Options Program guidance.
The employer generally must meet several conditions:
- Company size: Fewer than 25 full-time-equivalent employees.
- Average wages: Average annual wages below the applicable inflation-adjusted threshold.
- Employer contribution: At least 50% of the employee-only premium.
- Marketplace purchase: Coverage generally must be bought through SHOP.
The contribution rule applies to employee-only coverage, not the full cost of family or dependent coverage, as explained in the CMS employer guide to SHOP insurance. A qualifying employer may therefore need a separate policy for dependent premiums.
That means the 15-person scenario may warrant a tax-credit review, while the 50-person scenario generally won't fit the employee-count condition. Don't build the credit into the budget until eligibility, SHOP enrollment, wages, and contribution records have been verified. Premium costs not covered by the credit may still be deductible, which can reduce the effective cost of offering coverage.
Two additional offsets deserve attention. A Section 125 cafeteria plan can allow eligible employees to pay their share through pre-tax payroll deductions, subject to proper plan administration. Pre-tax premium conversions can also reduce taxable payroll for participating employees and may reduce the employer's payroll-tax burden. Have your benefits administrator and tax professional confirm the setup before implementation.
Benefits budgeting also sits inside a broader risk-management program. Employers reviewing a documented risk control for assessors can keep insurance-related compliance evidence organized rather than treating benefits and workplace risk as disconnected tasks.
If you want a defensible PMPM budget instead of a national average, visit Benely to compare more than 4,000 health plans, set an employer budget, and model employee contributions across coverage tiers. Use the platform and its HR support to turn broker quotes into a clear enrollment, payroll, and renewal decision.