
Insurers must spend at least 80% of premium dollars on medical care and quality work in the individual and small-group markets, and 85% in the large-group market, or pay a rebate on the shortfall. That's the rule behind Medical Loss Ratio, and it's probably sitting in your renewal packet right now next to a premium increase you didn't expect.
You don't need to become an actuary to use it. You need to know what counts toward the ratio, how a rebate gets calculated, and where a good-looking number can still leave you overpaying at renewal.
Table of Contents
- Medical Loss Ratio Explained in Plain Terms
- Federal Thresholds by Market and Recent Averages
- How State Rules and Premium Reviews Use MLR
- How to Trace a Rebate From Premium to Payout
- Worked Example for a 20-Employee Group
- Where MLR Misleads Employers and Brokers
- Building a Renewal Scorecard Around MLR
- Decide Your Renewal With Your Own Numbers
Medical Loss Ratio Explained in Plain Terms
Say you run a 20-employee company and your renewal notice lands showing a $600,000 annual premium. Your first question is fair and simple. How much of that money pays for care, and how much pays for everything else?
That's exactly what Medical Loss Ratio, or MLR, answers. It's the share of each premium dollar an insurer spends on clinical services and health-care quality-improvement activities, rather than administration, marketing, or profit.

Think of a grocery budget. Food is the medical care. Rent, advertising, and the owner's pay are everything else. MLR tells you what fraction of the budget bought food.
One $100 Breakdown
An insurer collects $100 in premiums. It pays $82 in claims and qualifying quality work, and keeps $18 for administration, commissions, taxes, fees, and profit. That's an 82% MLR.
- Counts toward the ratio: Doctor visits, hospital care, prescriptions, and qualifying quality-improvement work
- Doesn't count: Administration, marketing, broker commissions, and profit
The CMS guide to the MLR standard traces this back to the Affordable Care Act, which set the modern standard beginning in 2011 to make premium spending more transparent and give insurers a financial reason to direct revenue toward patient care. When the requirements were introduced, federal estimates indicated that as many as 74.8 million insured people would receive additional protections.
This applies to fully insured coverage, where the carrier carries the claims risk. If you're not sure which funding type you have, start with what a fully insured health plan is before you read any ratio.
MLR describes how premium dollars are spent. It doesn't tell you how good the coverage is.
That distinction matters. The ratio is a spending measure, and the thresholds below decide when a low number triggers real money back.
Federal Thresholds by Market and Recent Averages
A renewal quote can show an MLR that looks fine and still leave you paying more next year. The percentage has two jobs. It is the line that decides whether a rebate is owed, and it is a lens on how much of each premium dollar is already spoken for by claims. Match the quote to the right market before you treat it as a pass.
| Market | Minimum MLR | 2011 average | 2016 average |
|---|---|---|---|
| Individual coverage | 80% | 84.1% | 92.9% |
| Small-group coverage | 80% | 84.3% | 86.1% |
| Large-group coverage | 85% | 89.8% | 90.3% |
The chart below puts those two floors side by side so you can see the split at a glance.
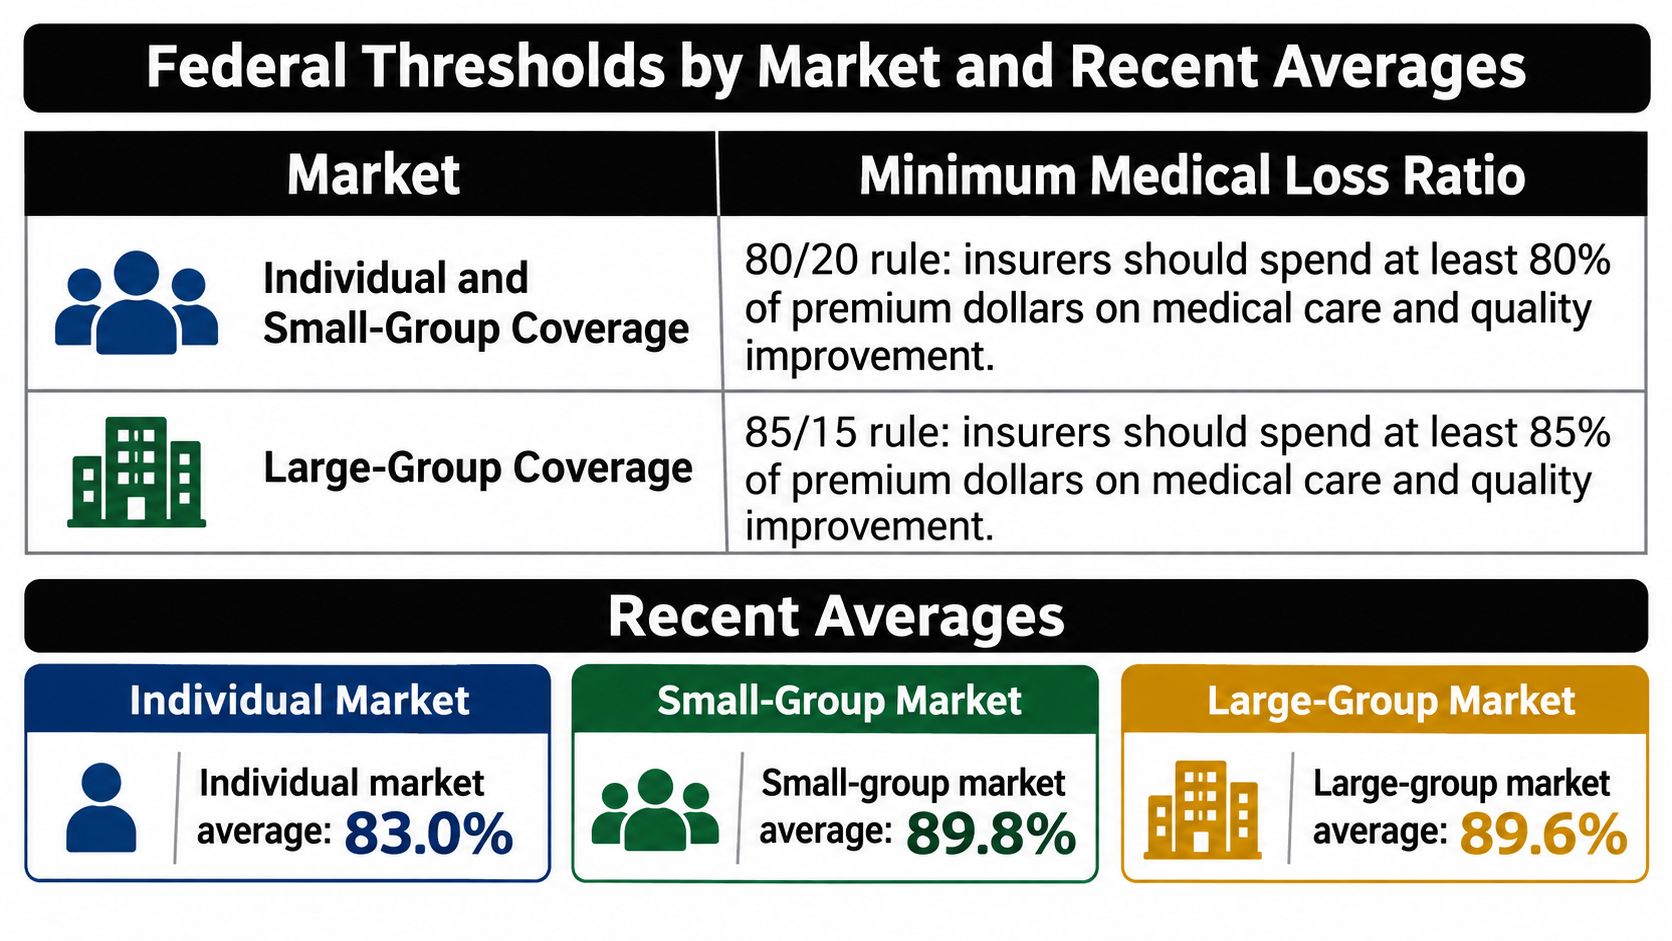
Individual and small-group coverage follows the 80/20 rule. At least 80 cents of every premium dollar goes to care and quality work, and up to 20 cents covers everything else. Large-group coverage follows the 85/15 standard, so the same plan has less room for overhead. An 84% result would clear the individual and small-group floor and miss the large-group floor.
The KFF analysis of Medical Loss Ratio rebates reports CMS averages of 84.1% in the individual market, 84.3% in small-group, and 89.8% in large-group in 2011, rising by 2016 to 92.9%, 86.1%, and 90.3%. The individual market gained 8.8 percentage points over that period, while small-group gained 1.8 points.
Where a Passing Ratio Still Hurts
Clearing the floor only answers the rebate question. It does not answer the budget question.
Use the 2016 large-group average as a worked case. 90.3% sits 5.3 points above the 85% floor, so that market-level result would not trigger a rebate. On $1,000 of premium, about $903 is claims and quality work and about $97 is everything else. The ratio looks comfortable. If those $903 came from a rough claims year, the carrier can still raise next year's premium. You get no check back, and the invoice gets larger. The percentage helped you see there is no rebate. It hid the cost problem that shows up at renewal.
A thin cushion misleads the other way. The 2011 individual average of 84.1% cleared 80% by only 4.1 points. One expensive year can erase a gap that small. By 2016 that average was 92.9%, which means more of the premium reached care. It does not mean the premium itself shrank. A household can spend a "healthy" share of income on rent and still be squeezed if the rent check grew.
Watch the Definition of Large Group
This trips people up. Federal descriptions of large-group coverage do not all use the same employee cutoff. The HealthCare.gov explanation of the 80/20 rule describes large groups as usually more than 50 employees. Confirm which definition your carrier and state apply to your plan, because that choice sets the floor at 80% or 85%.
If you want to hear the thresholds walked through out loud before you apply them, this short video covers the basics.
Practical rule: Find the market your plan sits in first, then compare its MLR to that market's floor, not to a generic number you remember.
Averages describe a whole market across a whole state. They do not describe your plan, your employees, or your renewal. Use them to see whether you are near the floor or well above it, then price that gap in dollars.
How State Rules and Premium Reviews Use MLR
The federal rule applies to health insurance issuers in the individual, small-group, and large-group markets. States monitor compliance on the ground and publish MLR reports by state and by market, which is where you'll go looking for your carrier's number.
Confirm Your Funding Type First
Self-funded employer plans, where your company carries the claims risk and a carrier or administrator just processes the paperwork, generally sit outside these rebate rules. That one fact changes everything. If you're self-funded, the ratio is interesting background, not a rebate trigger for you.
Don't guess. Ask your broker or carrier rep directly which arrangement you have, and get the answer in writing with your renewal documents.
Rate Review on the Front End
Insurers file proposed rates with state regulators before those rates reach you. Regulators examine projected claims and the MLR the insurer expects to hit at those prices. So when a renewal increase shows up, it should be explainable against expected claims costs, not just handed to you as a number.
Some states also set standards stricter than the federal floor. When that happens, the state rule is the binding test, and a carrier can clear the federal bar while still falling short at home.
MLR touches your premium at two points:
- Front end: Rate filings, where projected spending justifies the price
- Back end: Rebates, paid when actual spending falls short
A renewal increase you can't trace back to expected claims is a question, not a bill.
Three steps put you in a stronger position:
- Confirm the funding type of your plan before applying any ratio.
- Find your state's MLR report and your carrier's rate filing for your market.
- Ask the carrier how the projected MLR was built into your renewal rate.
How to Trace a Rebate From Premium to Payout
Rebates confuse people because the check, when one arrives, rarely matches any number on your renewal. The process below shows why. Each step happens at the level of an insurer's whole book of business in one market in one state.
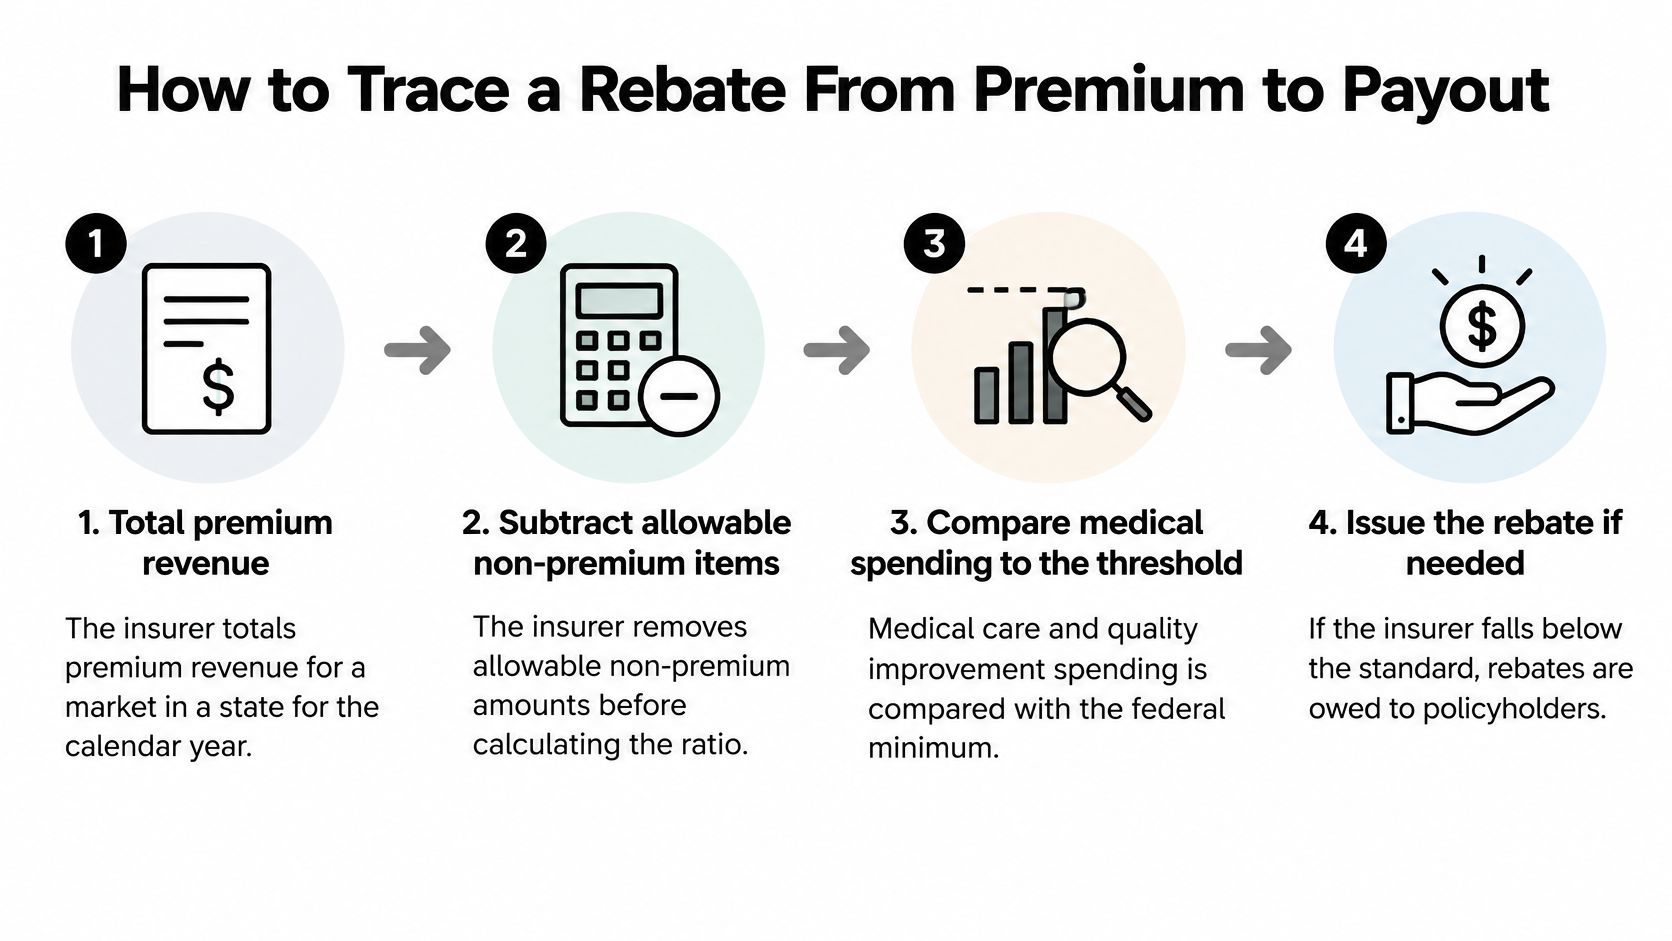
- Total the premium revenue. The insurer adds up premium revenue for a market in a state for the calendar year. This is the starting pool everything else is measured against.
- Remove allowable non-premium items. Certain taxes and fees come out to reach the adjusted premium base, so the ratio isn't distorted by money the insurer never kept.
- Total qualifying spending. The insurer adds up clinical services and quality-improvement spending, leaving out administration, marketing, and profit.
- Do the division. Qualifying spending divided by adjusted premium gives the MLR, which gets compared with the applicable floor.
- Calculate the shortfall in dollars. If the ratio sits below the floor, the gap converts into a dollar amount across that entire market.
- Apply credibility adjustments where enrollment is limited, since smaller insurers aren't judged solely on volatile claims.
- Pay the rebate. Enrollees receive premium credits or checks, and group-plan rebates pass through according to plan terms.
Why Credibility Changes the Answer
A few expensive claims can swing a small pool's percentage wildly, so the rules soften the judgment for smaller books. The CMS fact sheet on Medical Loss Ratio identifies insurers with 1,000 to 75,000 people enrolled for an entire calendar year as having "partially credible" experience, and regulations add a credibility adjustment to their reported MLR. Insurers with 75,000 or more enrollees are "fully credible" and owe rebates based on their actual MLR without that adjustment.
Two carriers with similar premium and claims patterns can face different rebate outcomes for exactly this reason. It's not favoritism. It's statistics.
Your share of any rebate depends on how much of that insurer's whole book your premiums represent, not on your own claims alone.
Ask your carrier for its rebate history in your state and market, and pull the state's MLR report to check the answer. This walkthrough is a simplified version of the formula, and the current CMS rules govern any real calculation.
Worked Example for a 20-Employee Group
Let's run real arithmetic on the $600,000 premium from earlier. That's roughly $30,000 per covered employee across 20 employees, and it gives you a clean base to practice on.
The Baseline Calculation
At the 80% floor for small-group coverage, required qualifying spend is $600,000 × 0.80 = $480,000. The remaining $120,000 can cover administration and profit. Every scenario below measures itself against that $480,000 line.
| Scenario | Versus 80% floor | Shortfall owed |
|---|---|---|
| Plan A at 82% MLR | Above floor | $0 |
| Plan B at 78% MLR | Below floor by 2 points | $12,000 |
| Plan D at 80% MLR | Meets floor | $0 |
The CMS fact sheet on getting your money's worth from health insurance frames this exact benchmark for benefits administrators. A small-group plan at 82% sits above the federal threshold, while a comparable plan at 78% may generate a rebate obligation.
Reading Each Scenario
Plan A at 82% spends $492,000 on qualifying care and quality work. That's $12,000 above the requirement, so no rebate is owed. Clean result, but hold that thought.
Plan B at 78% spends $468,000. That's $12,000 short of the $480,000 requirement, and that gap is where a rebate obligation starts.
Plan D at exactly 80% spends $480,000 and meets the floor precisely. Nothing owed, nothing extra spent.
A fourth case sharpens the picture. Plan C at 76% would spend $456,000, a $24,000 shortfall. Double the percentage gap, double the dollars.
The Part Most People Get Wrong
Your group doesn't receive $12,000 or $24,000 directly. The shortfall is a market-level obligation, calculated across the insurer's entire book in your state and market. Your slice depends on your share of that book and on your state's rebate rules.
As a rough illustration only, if a $12,000 shortfall were returned across your 20 covered employees, that's $600 each. Treat that as a way to feel the size of the number, not as a promise.
Formula to reuse: Required spend equals your premium times the floor. Compare actual qualifying spending against that figure.
One more caution from the same CMS framing. Quality-improvement spending counts only when it's evidence-based, patient-specific, and designed to measurably improve health outcomes. That makes the classification of wellness, care-management, and population-health programs important when a carrier explains its numerator.
And notice Plan A again. It clears the floor at 82%, yet it could still be your most expensive option if its underlying premium is inflated. The ratio alone can't choose your plan.
Where MLR Misleads Employers and Brokers
A group opens its renewal packet, sees an MLR above the federal floor, and assumes the plan is efficient. Then the premium increase lands. The ratio answered a regulatory question, not the budget question the owner was asking.
Three misreadings drive bad renewal calls. Each sounds reasonable until you separate the rebate trigger from the budgeting lens.
A high MLR does not mean a better plan. The ratio climbs when claims run high, when provider prices are expensive, or when the risk pool skews sicker. More premium dollars flow to care, and you still pay more for that care. The CMS Medical Loss Ratio data resources publish figures by state and market because the ratio is not an apples-to-apples score for every employer plan.
A low MLR does not prove waste. An insurer spending on prevention, care management, or technology may see those costs count toward the numerator only when they meet the rules. Carriers can classify wellness and population-health programs differently, so two honest insurers can report different ratios on similar real-world effort. Because MLR is claims divided by premium, a premium that rises faster than claims pushes the ratio down and can create a rebate while your total spend still climbs. That is where a healthy-looking ratio hides the cost problem that matters at renewal.
The ratio is not calculated for your company. It is calculated at market and state levels. Two plans with identical ratios can differ sharply in premium, network, employee cost sharing, and the experience someone has when a claim is filed. That is the budgeting lens: your renewal depends on your premium trend, your claims per member, and your network, not on the market ratio alone.
A Fuel Gauge, Not a Route
MLR works like a fuel gauge. It shows how much of the tank was used on the road. It says nothing about whether the route was a good one, whether you overpaid for gas, or whether passengers enjoyed the trip. The ratio also says nothing about claims friction. Provider-side denial management for specialty practices deals with how denied claims are reworked and paid, which is a separate operational concern from your premium and rebate math.
Funding structure changes the picture again. A self-funded arrangement shifts claims risk from the insurer to the employer, so the fully insured MLR rules do not answer the same question. The mechanics of self-funded insurance belong to that different model.
Treat MLR as what it is: a regulatory financial indicator and a rebate trigger. It was never designed to measure value, affordability, or care quality on its own. Use it to check whether a rebate is owed, then use your own premium, claims, and network data to decide whether the renewal makes budget sense.
Building a Renewal Scorecard Around MLR
A scorecard fixes the single-number problem. Put MLR in the first row, then surround it with the measures that tell you whether the plan works for your people and your budget.
| Metric | What it tells you | Where to find it |
|---|---|---|
| MLR against federal floor | Whether the insurer met the 80% or 85% threshold | CMS and state MLR reports |
| Premium trend | How fast the renewal cost is rising | Renewal proposal compared with prior-year rates |
| Claims per member | Utilization and cost pressure on the plan | Carrier claims and utilization reports |
| Network adequacy | Whether key doctors and facilities are in network | Carrier provider directory checks |
| Employee contribution | Real out-of-pocket cost for workers | Summary of benefits and coverage |
| Employee satisfaction | Day-to-day experience of coverage | Annual employee survey results |
| Rebate history | Whether past shortfalls were paid and how | Carrier rebate notices and state filings |
Run These Five Steps in Order
- Pull the carrier's MLR for your plan's market and check it against the floor. Our own process starts here as well. In the Evaluate step, we compare your current insurance plans with other market options to find the most cost-effective solutions, and we shop, analyze, and personalize group benefits in simple steps while you make the final decision.
- Compare the proposed premium increase with the trend in the carrier's claims. If premiums rise much faster than claims, ask why. Our breakdown of how group health insurance renewal rates are calculated shows what carriers put into that number.
- Check the provider network against where your employees receive care. Pull your team's key doctors, hospitals, and specialists and verify each one in the carrier directory.
- Calculate the employee cost share at expected usage. A cheaper premium paired with a deductible your team can't afford isn't cheaper.
- Ask about prior rebates. Find out whether any rebate was paid in earlier years and how it was passed through to the group.
The scorecard doesn't replace judgment. It makes the trade-offs visible before you sign.
Fill in every row, even the soft ones like satisfaction. A plan that wins on ratio and loses on network will cost you in turnover and frustration long before it costs you in premiums.
Decide Your Renewal With Your Own Numbers
An MLR answers two narrow questions: did premiums go toward care, and did the carrier clear its floor. It says nothing about whether your premium is well spent. Four steps, run in order, turn the ratio into an answer you can sign off on.
A Four-Step Decision Path
- Confirm funding type and market, then check your carrier's MLR against the 80% or 85% floor that applies to you.
- Multiply your premium base by the floor to get required spend, using the worked-example formula. Now you have a dollar line, not just a percentage.
- Watch for the mismatch. If MLR clears the floor but your premium trend outpaces claims trend, or the network misses key providers, request a written explanation before signing anything.
- Record your scorecard numbers and revisit them at the next renewal. Year-over-year comparisons are where this tool earns its keep, because one snapshot can flatter or punish a carrier unfairly.
A ratio works like a smoke alarm. It sounds when something is badly wrong, and it stays quiet through plenty of problems that still cost you money. The mismatch in step three is the part worth staring at, because a clean ratio can hide a premium that climbs faster than the claims behind it.
You can run the comparison yourself from carrier filings and state reports, or hand it to a broker or benefits team. Benely's advisors compare your current plans with other market options as a standard step, so the ratio sits next to network and cost rather than standing alone.
Line up your renewal notice, last year's rates, and a list of the providers your employees use. With those three things in hand, the ratio stops being an abstract federal rule and becomes a budgeting lens you control.
Bring us your current renewal and we'll compare your plans with other market options so you can weigh cost and coverage side by side. You make the final decision, and we handle the shopping and analysis behind it. Start the conversation at Benely today.