 Employee Benefits
 HR & Compliance
 Technology
 Wellness
 PEO Solutions
Your renewal packet has arrived. The premium is higher, participation looks uneven, and a department head says competitors offer better benefits. You're expected to recommend changes, but one question keeps getting in the way: are your numbers high, low, or different because your company isn't being compared with the right employers?
That uncertainty creates expensive decisions. A founder may cut a benefit employees value because the cost looks unattractive in isolation. An HR manager may add a feature that sounds competitive but does little to improve enrollment. A CFO may approve a plan change without knowing whether the comparison uses the same workforce, geography, plan structure, or reporting period.

Table of Contents
- Introduction Why Guessing About Benefits Costs You More
- What Benchmarking Really Means in HR and Benefits
- The Three Types of Benchmarks Every Employer Should Know
- Why Benchmarking Matters for Attraction Retention and Spend
- Common Metrics That Make Benefits Benchmarking Useful
- How to Gather and Interpret Benchmark Data Without Misleading Results
- Next Steps to Benchmark Your Benefits With Confidence
Introduction Why Guessing About Benefits Costs You More
Consider a growing employer reviewing health benefits before renewal. The company's contribution has increased, yet employees still describe the package as difficult to understand. Leaders can see the cost, but they can't tell whether the problem is the plan design, employee communication, market pricing, or a mismatch between the benefits and the workforce.
Without context, every decision becomes a reaction. The employer might compare this year's premium with last year's premium and call the difference a problem. That comparison says something about change over time, but it doesn't explain how the program compares with similar employers or whether employees receive meaningful value from it.
Benchmarking supplies the missing reference point. It compares selected measures against a relevant peer group or recognized standard, then helps decision-makers determine which gaps deserve attention. The method applies across business functions. The University of Manchester's research-metrics guidance describes benchmarking as a comparison with peers or defined standards that can reveal strengths, collaboration opportunities, and relative standing.
Benefits benchmarking makes that idea practical for HR. You can examine employer contributions, total premium, enrollment, plan design, employee experience, and related indicators. The purpose isn't to copy another company's package. It's to understand where your program stands, identify trade-offs, and set targets that fit your workforce and budget.
The practical question isn't “Are our benefits expensive?” It's “Expensive compared with which employers, under which conditions, and for what employee value?”
This guide explains what is benchmarking, how it works in benefits, which metrics deserve attention, how bad peer selection distorts results, and why a benchmark should become part of an ongoing decision system rather than a report that sits in a shared drive. You'll also see where a benefits partner such as Benely can help employers organize comparisons and turn findings into an action plan.
What Benchmarking Really Means in HR and Benefits
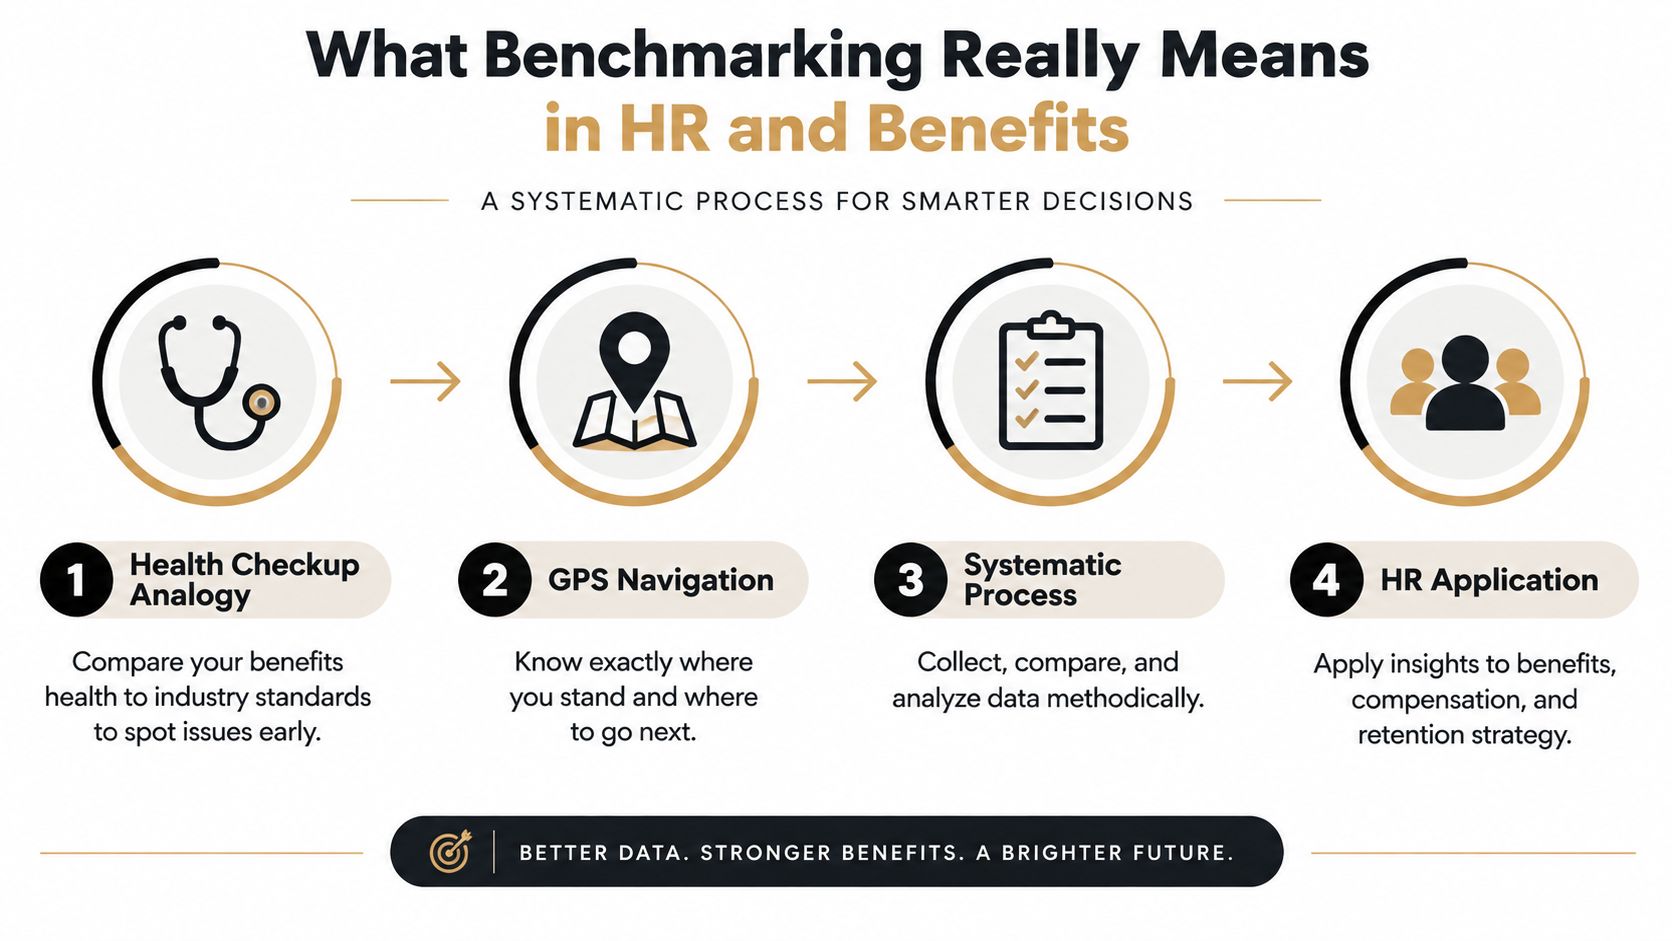
A simple analogy helps. A health checkup doesn't tell you whether a reading matters by displaying a number alone. The clinician compares the reading with an appropriate reference range, considers your history, checks related indicators, and decides what action makes sense. A GPS works similarly. It needs your current location, destination, route conditions, and constraints before it can offer useful guidance.
Benchmarking is a structured version of that process for organizational decisions. The National Academies describes it as a systematic process of measuring performance against recognized leaders to identify practices that can be adapted for superior performance. The comparison matters, but the adaptation matters just as much.
Start with a decision, not a spreadsheet
A useful benefits benchmark begins with a management question:
- Cost decision: Is our employer contribution sustainable relative to comparable employers?
- Talent decision: Does our package support recruitment and retention in the markets where we hire?
- Employee experience decision: Are employees enrolling and using the benefits we fund?
- Design decision: Which plan features create value, and which create complexity without enough return?
That question determines the data you need. A comparison built to assess affordability won't necessarily answer whether employees understand the plan. A comparison built for recruitment may need different peers from one designed for financial planning.
In HR, benchmarking can cover benefits, compensation, participation, leave, wellness, and retention-related measures. The method is broader than comparing a single premium. A practical research-metrics guide lists measures such as field-normalized citation impact, publication volume, average citations, collaboration, and high-ranking journal publication as examples of how multiple indicators can work together in another field. The transferable lesson is clear: one metric rarely captures the whole picture.
What benchmarking isn't
Benchmarking isn't a one-time ranking exercise, a demand to imitate the market leader, or proof that the highest-performing peer uses the right solution for your organization. It also isn't a substitute for judgment. A smaller employer with a different workforce, cash position, hiring market, and risk tolerance may need a different benefits strategy from a much larger company.
Historical context reinforces the point. Modern management benchmarking is widely traced to Xerox in the late 1970s, including competitive comparisons around 1979, after the company studied Japanese competitors and then broader best-in-class organizations, as described in this history of benchmarking from EBSCO. The practice developed from point-to-point comparison into a repeatable approach for measuring performance, identifying gaps, and setting rational targets.
Watch the short video for another visual explanation of the process, then apply the same discipline to your benefits decisions.
The Three Types of Benchmarks Every Employer Should Know
Employers often ask for “the benefits benchmark” as if one number could answer every question. In practice, benefits benchmarking has several jobs. Cost, participation, and plan design benchmarks examine different parts of the employee value proposition, so combining them produces a more reliable view.
| Benchmark Type | Question It Answers | Example Metrics |
|---|---|---|
| Cost benchmark | Is our spending competitive and sustainable? | Employer contribution, total premium, per-employee cost |
| Participation benchmark | Are employees engaging with what we provide? | Enrollment, utilization, wellness engagement |
| Plan design benchmark | How does the structure of our offering compare? | Deductibles, employee contributions, coverage features, wellness provisions |
Cost benchmarks
Cost benchmarking focuses on the financial side of the program. It can show whether your employer contribution or total premium sits above, below, or near a selected peer group. That result needs context. A lower cost may reflect narrower coverage, higher employee contributions, or a workforce with different needs.
Use cost data when leaders need to set a budget, evaluate renewal options, or understand whether a proposed change moves the organization away from its intended market position. Employers reviewing executive rewards may also find a separate resource on executive compensation planning useful when aligning benefits and broader reward decisions.
Participation benchmarks
Participation tells you whether employees are choosing or using the benefits available to them. Low enrollment might signal poor communication, affordability concerns, limited perceived value, or a plan that doesn't fit the workforce. High enrollment doesn't automatically prove success, because employees may enroll because alternatives are limited.
Participation should be read alongside employee feedback and plan utilization. Together, those signals can distinguish a communication problem from a design problem.
Plan design benchmarks
Plan design comparisons examine the shape of the offer. Deductibles, contribution structures, coverage levels, paid leave, wellness features, and navigation support can affect both cost and perceived value.
A plan design benchmark is most useful when it answers a specific question. If recruiting is difficult, compare the features candidates care about in the relevant labor market. If employees struggle with affordability, focus on contribution levels and out-of-pocket exposure rather than copying an unrelated employer's full package.
Why Benchmarking Matters for Attraction Retention and Spend
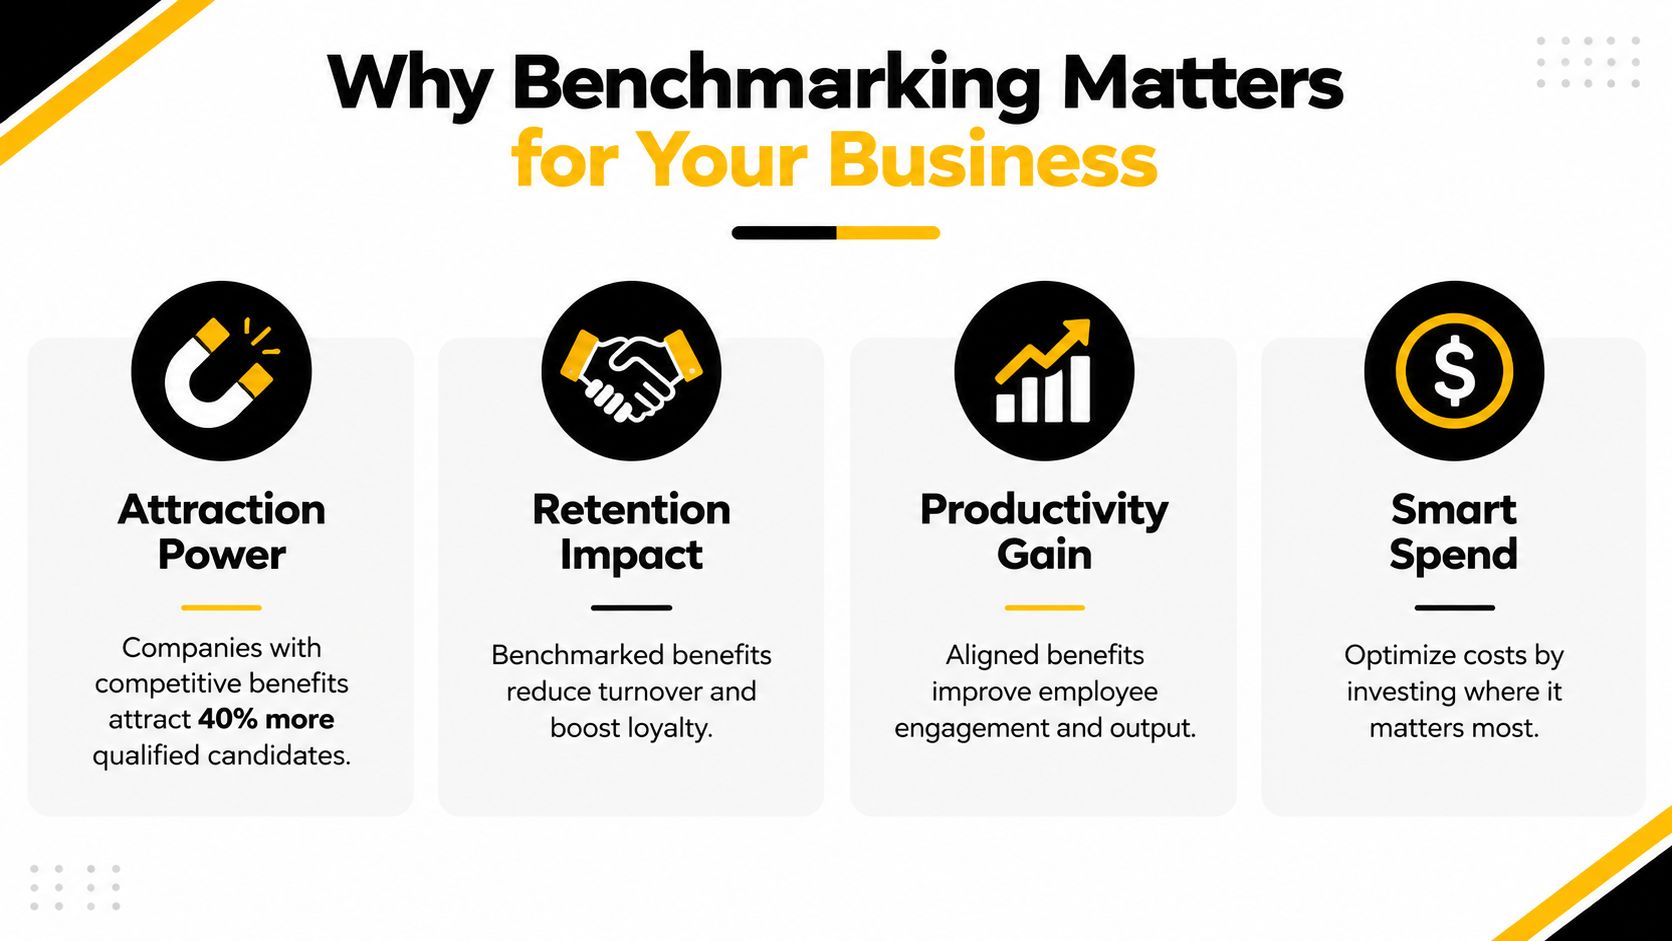
Benefits decisions affect more than the renewal budget. They influence how candidates evaluate an offer, how employees judge whether the organization understands their needs, and how finance leaders allocate limited reward dollars. Benchmarking gives those conversations a shared evidence base instead of leaving each stakeholder with a different anecdote.
A hiring manager may say candidates reject offers because the health plan feels weak. A benefits administrator may see moderate enrollment and conclude the plan is acceptable. A CFO may focus on rising premiums. Each person may be observing a real signal, but none can identify the right response without comparing cost, design, participation, and workforce context together.
Attraction and retention
A benefits package can support recruitment when it matches the expectations of the people an employer wants to hire. Benchmarking helps leaders test that assumption against relevant market peers rather than relying on a competitor's sales pitch or an isolated candidate comment.
Retention requires a different lens. Employees may value predictable costs, accessible care, straightforward enrollment, and benefits that fit different life stages. A benchmark can reveal where the package differs from peers, but employee feedback helps determine whether the difference is meaningful.
Productivity and employee value
Benefits also sit within a wider workforce investment conversation. Finance leaders may use measures such as revenue per employee to understand productivity, and AmbitionCFO's workforce productivity resource provides useful context for that broader discussion. Benefits benchmarking doesn't prove that a particular plan causes productivity changes. It helps employers examine whether their reward investment supports the workforce strategy they're trying to execute.
That distinction protects credibility. A benchmark should inform a decision, not make a promise the data can't support.
Spend control through better choices
Cost control doesn't mean choosing the cheapest option. It means understanding where spending creates value and where complexity or unused features may be consuming budget. The Benely HR total rewards resource can help frame benefits alongside compensation, recognition, development, and other elements of the employee experience.
The process should continue after renewal. Peer offerings change, workforce composition shifts, and employees respond to plan changes. The Global Benchmarking Network's benchmarking glossary and FAQ emphasizes that wrong organizations and wrong metrics can undermine results, and that benchmarking works best as a continuous practice rather than a single project.
Common Metrics That Make Benefits Benchmarking Useful
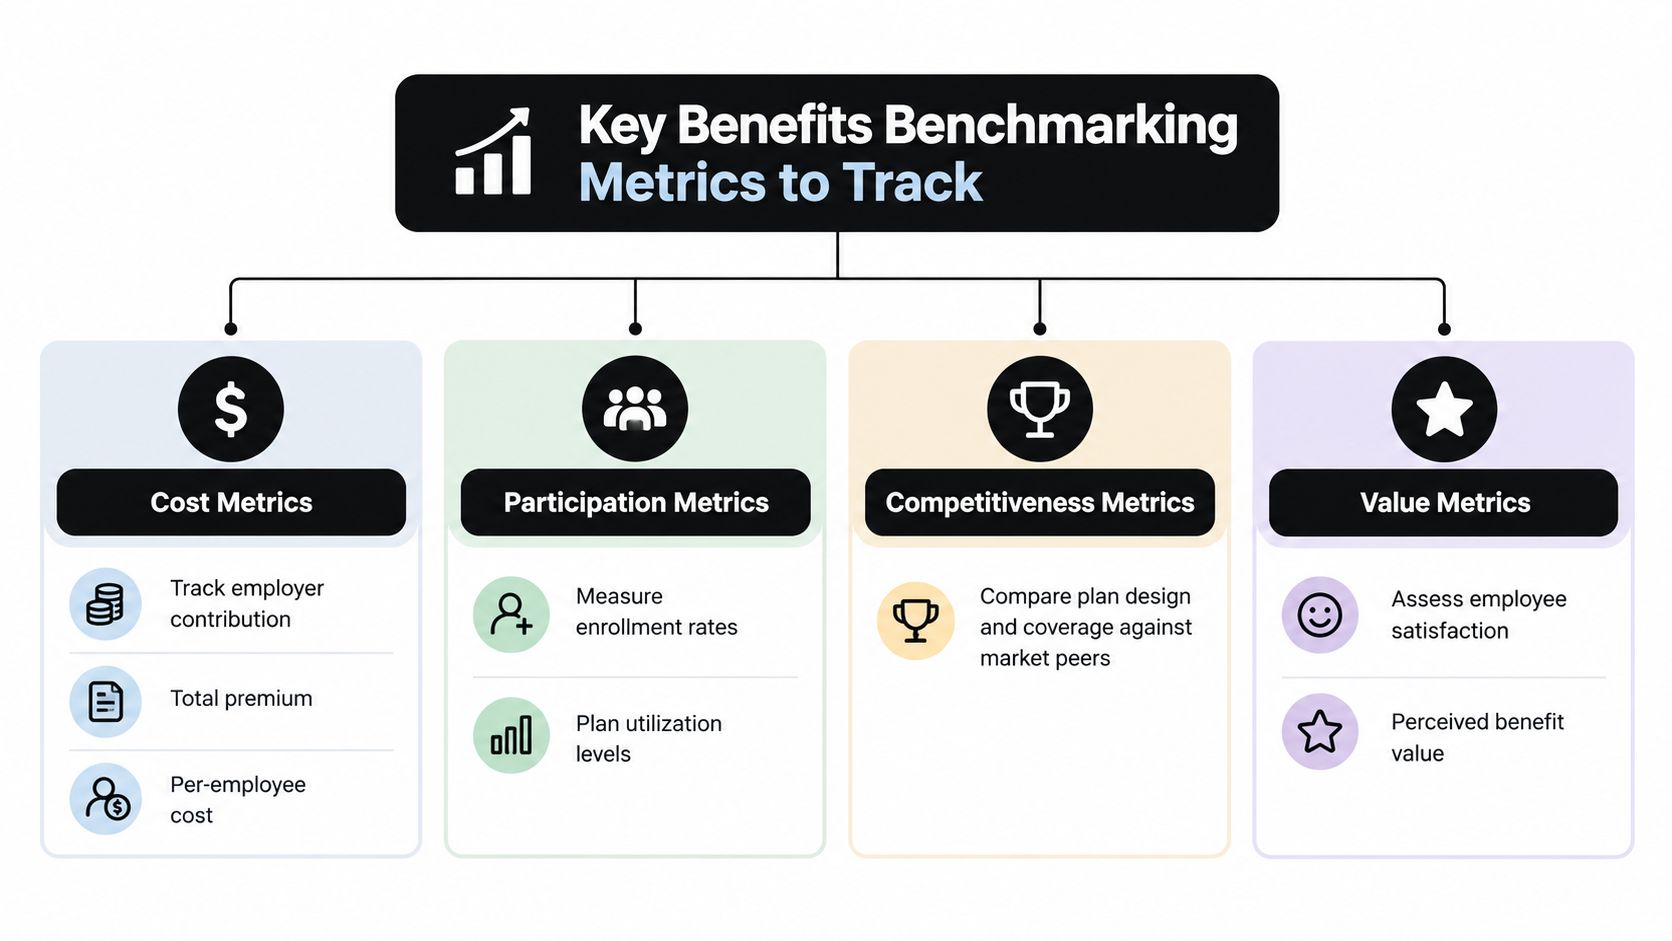
A benefits benchmark becomes useful when several indicators explain one another. Cost tells you what the program consumes. Participation shows whether employees engage with it. Competitiveness examines the offer against peers, while value measures help you understand how employees experience the program.
Cost metrics need a denominator
Start with the employer contribution, total premium, and per-employee cost. Always define the denominator and period before comparing results. A total premium can look high because the organization has more covered dependents, while a per-employee figure may conceal a different mix of full-time and part-time workers.
Ask what decision each measure supports:
- Employer contribution: How much of the premium does the organization fund?
- Total premium: What is the overall financial commitment to coverage?
- Per-employee cost: How does spending relate to workforce size?
- Employee contribution: What portion of the cost reaches the employee?
A cost measure without plan design context can mislead. Two employers may spend similar amounts while offering very different deductibles, networks, coverage, or support.
Participation metrics reveal behavior
Enrollment rates show whether employees select a plan. Utilization levels can indicate whether employees access the services included in the package. Wellness engagement may show interest in related programs, but low activity can reflect weak communication, inconvenient access, or limited relevance rather than employee indifference.
Read participation beside employee comments and eligibility rules. An employer shouldn't treat non-enrollment as a simple vote against the benefit if employees have access to coverage through a spouse or another source.
Competitiveness and value complete the picture
Competitiveness metrics compare plan design and coverage with market peers. Value metrics consider satisfaction and perceived usefulness. These indicators matter because employees don't experience a premium as an abstract finance number. They experience the deductible, payroll deduction, provider access, claims process, and ease of finding answers.
The RMIT guide to research-metrics benchmarking demonstrates why multiple quantitative indicators are often needed rather than relying on a single score. Benefits leaders can apply the same principle by examining cost, participation, design, and employee experience as a connected set.
Read the pattern, not the headline number. A low cost with low participation and poor perceived value calls for a different response from a higher cost paired with strong engagement and an intentional market position.
Treat benchmark results as estimates, not absolute truth. NIST's genomics benchmarking guidance recommends representative truth sets, stratification by relevant categories, and confidence intervals for measures such as precision and recall. Benefits data has different subject matter, but the measurement lesson transfers: aggregate results can hide important subgroups, and uncertainty deserves a place in the discussion.
How to Gather and Interpret Benchmark Data Without Misleading Results
The safest benchmarking process follows a sequence. Employers that skip the early definitions often spend time collecting precise answers to the wrong question.
Define the measurement before collecting data
Write down the decision, population, period, units, and target. Decide whether the comparison concerns all eligible employees, enrolled employees, a location, a job family, or another defined group. Establish whether costs include employer and employee contributions, administrative fees, dependent coverage, or other components.
NIST's benchmarking guidance for automated evaluations recommends defining evaluation objectives first, selecting benchmarks, implementing the test, and then analyzing and reporting results. The sequence reduces measurement noise because everyone knows what the result is supposed to answer.
Standardize and normalize the comparison
Raw numbers aren't automatically comparable. A benefits cost reported per enrolled employee shouldn't be compared directly with a cost reported per eligible employee. Different plan years, workforce mixes, geographic markets, and contribution rules can distort the apparent gap.
Create a short data dictionary before analysis. Define each metric, its unit, inclusion rules, source, reporting period, and limitations. If a peer reports participation using eligible employees and your organization uses enrolled employees, either normalize the data or label the comparison as unsuitable.
Select peers for relevance
The right peer group may share an industry, region, workforce profile, hiring market, company stage, or benefits philosophy. “Best practice” isn't a universal category. A large employer with a different risk profile may be a poor reference for a smaller organization, even if its package appears attractive.
Use more than one comparison lens when the decision requires it. Industry peers can inform competitive positioning, while regional peers may better reflect candidate expectations and provider availability. Do not mix groups without clear rationale. Document why each peer belongs in the set.
For a practical employee-feedback instrument, use Benely's employee benefits survey template alongside external data so employee experience doesn't disappear behind market averages. For compensation context, Synopsix salary survey findings can provide another reference point, but salary comparisons shouldn't be treated as a substitute for benefits analysis.
Interpret segments and uncertainty
An aggregate result can hide differences by location, employee group, plan choice, or dependent status. Break results into meaningful segments when the sample and data quality support it. Then ask whether the difference is large enough, reliable enough, and relevant enough to change the decision.
The scoring rule should match the decision. If the goal is affordability, give appropriate attention to employee contributions and out-of-pocket exposure. If the goal is recruitment, examine the features that candidates encounter. If the goal is utilization, look at access and communication as well as enrollment.
Finish with a decision record. State the finding, evidence, limitations, proposed action, owner, and review date. That record turns a benchmark from a presentation into a management tool.
Next Steps to Benchmark Your Benefits With Confidence
A practical benefits benchmark can begin with a focused working session rather than a large research project. Put the decision in writing, then test whether the available data can answer it.
- Define the objective: Choose whether the immediate priority is cost, attraction, retention, participation, plan design, or employee experience.
- Choose comparable peers: Match employers by the factors that affect the decision, and document exclusions.
- Clean the measures: Standardize definitions, reporting periods, denominators, contribution rules, and eligibility populations.
- Use multiple indicators: Read cost with participation, design, and employee feedback instead of relying on a single score.
- Act on material gaps: Assign an owner, set a review point, and distinguish a plan problem from a communication or access problem.
- Recalibrate regularly: Update the comparison when the workforce, market, plan, or business strategy changes.
Employers may also benefit from a partner when data sits across spreadsheets, carrier documents, payroll, surveys, and enrollment systems. Benely describes a platform that lets companies compare more than 4,000 health plans, benchmark programs, manage benefits activity, and rate their current process to receive a free 30-page guide. Those product details are available through Benely's benefits platform.
The future of benchmarking will demand more care, not less. The Stanford AI Index 2026 technical chapter describes saturation in familiar AI tests such as MMLU, GSM8K, and HumanEval, alongside movement toward harder, more domain-specific evaluations, including SWE-bench Live and continuous leaderboards. The business lesson is useful: when a measure becomes too familiar, it may stop distinguishing meaningful performance. Benefits leaders should keep asking whether an old benchmark still reflects the decision they need to make.
Benely helps employers compare health plans, benchmark benefits programs, organize employee feedback, and manage enrollment and related HR workflows in one place. Visit Benely to rate your current process, access the free 30-page guide, and turn benefits benchmarking into a repeatable decision system.