Your benefits report flags red, finance asks who's overspending, and you know the honest answer is nobody. You hired faster than anyone planned. That's the confusion flexible budgeting solves. Instead of judging a growing team against a headcount you guessed months ago, you recalculate what benefits should've cost for the people you enrolled. Done well, the benefits of flexible budgeting are clearer cost control, fairer accountability, and faster decisions. Done loosely, it becomes an excuse machine. The difference is governance, and that distinction runs through every step below.
Table of Contents
- What Flexible Budgeting Means for Employee Benefits
- Static and Flexible Budgets When Headcount Changes
- How Flexible Budgeting Strengthens Cost Control
- How Employees Gain a Better Benefits Mix
- When Flexible Budgets Backfire and Guardrails to Set
- Benefits Budget KPIs to Track Each Quarter
- How to Set Up Flexible Budgeting in a Benefits Platform
- Confirm Your Flex Rules Before the Next Enrollment
What Flexible Budgeting Means for Employee Benefits
A company budgets $80,000 a month for 100 employees. By midyear, headcount reaches 120, and the report shows a $19,000 overrun. That figure alone cannot tell you whether benefits spending ran high or the company grew. A static budget stays fixed, even as the activity behind its costs changes.

The Scaled Recipe Test
A recipe for more guests calls for more flour and water, while the oven temperature stays the same. Benefits costs can behave similarly. Per-employee premiums and enrollment-linked fees tend to rise with headcount; platform subscriptions, compliance work, and reserves tend to stay roughly fixed.
A flexible budget recalculates for the activity that happened, separating changes in volume from changes in spending. The distinction is useful only when each cost has a clear owner, approval thresholds, and fixed guardrails. Otherwise, adjusting the budget can blur whether higher costs reflect more people or spending beyond the agreed limits. For a step-by-step explanation, see how flexible budgets explain variances.
Flexible budgeting took shape in the early twentieth century. John H. Williams's 1934 book The Flexible Budget helped formalize the approach, as traced in the IBIMA journal history of flexible budgeting.
Quick test: For each benefits line, ask whether its cost changes with headcount or enrollment. If it does, flex that line; if it does not, keep it within its fixed guardrail.
Static and Flexible Budgets When Headcount Changes
One rule makes the table below easy to read. The plan is 100 employees at $800 per employee per month, a static budget of $80,000. Actual cost runs $825 per employee in every scenario.
| Scenario | Headcount | Flexed budget at $800 | Actual spend at $825 | Static variance | Flexed variance |
|---|---|---|---|---|---|
| Fewer hires | 80 | $64,000 | $66,000 | -$14,000 (looks favorable) | +$2,000 |
| On plan | 100 | $80,000 | $82,500 | +$2,500 | +$2,500 |
| Growth midyear | 120 | $96,000 | $99,000 | +$19,000 | +$3,000 |
Reading the Columns
The flexed budget is $800 times actual headcount. The static variance compares actual spend with the original $80,000. The flexed variance compares actual spend with the flexed budget, which is the comparison that tells you something about spending discipline.
Walk through the first row slowly, because it's where readers get tripped up. At 80 employees, the static view shows $14,000 favorable. That looks like a win. But each employee cost $25 more than planned, which is a real $2,000 overspend hiding inside good-looking news. Hiring less masked a rate problem.
The growth row flips the story. At 120 employees, the static view screams $19,000 over, which sounds alarming. The flexed view isolates only $3,000, the true cost of paying $25 more per head. The other $16,000 is just the planned cost of 20 extra people who were supposed to be covered.
The Reading Rule
- Flexed variance: Should be small and explainable by price, plan choice, or utilization.
- Static variance: Mostly reflects headcount, so don't judge a benefits lead by it.
The same logic applies to smaller line items that scale with people, such as welcome kits, where negotiating minimum orders for company swag keeps unit costs predictable as hiring changes.
Recompute the flexed budget at each month-end using actual enrolled employees. Do that before you judge the period, not after someone's already been blamed.
How Flexible Budgeting Strengthens Cost Control
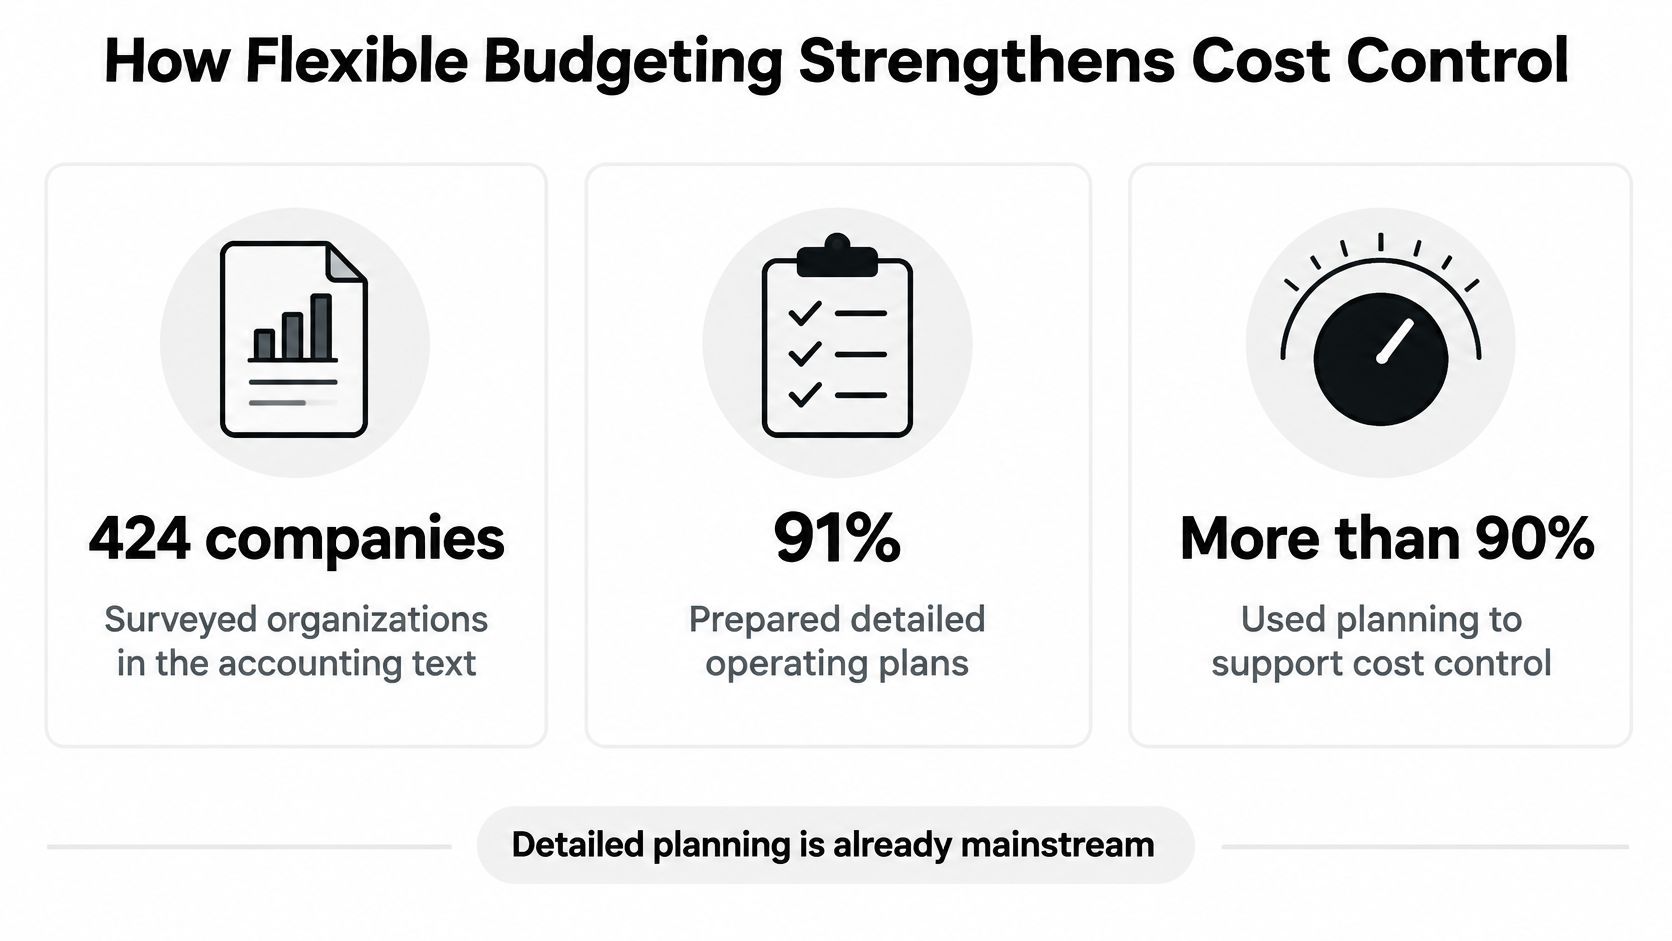
Detailed planning isn't a niche practice. An accounting text summarized survey evidence from 424 companies and found 385 organizations, or 91%, prepared detailed operating plans, according to the Elsevier accounting text on budgetary control. More than 90% also prepared actual-versus-budget reports for general and administrative expenses, sales, and profit. The habit of comparing plan to actual is already mainstream. Flexible budgeting just makes the comparison fair.
Here's how the headline survey figures break down visually.
The pressure to adapt is current, too. In 2025, 65% of CFOs surveyed by PwC said they were adjusting financial forecasts and budgets, while 61% were implementing cost reductions excluding layoffs, per the PwC 100-day CFO outlook. Adaptable planning isn't theory. It's what finance leaders are already doing.
Three Advantages in Benefits Terms
- Cost control: Variance ties to drivers you can act on, such as price per enrolled employee. If that number creeps up, you renegotiate or adjust contributions. Our breakdown of health insurance costs for employers shows how those per-employee drivers build up.
- Agility during growth: You can model several headcount levels before committing to hires or plan changes, so a hiring surge doesn't blow up the annual plan.
- Fair accountability: Your benefits lead isn't judged for enrollment volume they don't control, only for the rate they negotiated and the mix they managed.
This short video reinforces how the comparison works in practice.
In your next cycle, label each benefits line volume-driven or rate-driven. Keep only the rate-driven lines under direct manager control.
How Employees Gain a Better Benefits Mix
A benefits budget can work like a set amount shared across several choices. When the amount can shift with enrollment, employees can get support that better matches the plans and services they select, while the total budget stays within its limit. That flexibility still needs clear approval rules, or a shift in spending can hide an overspend rather than solve a mismatch.
A Worked Example
Suppose a company has 100 employees, and 30 are eligible for a high-deductible plan paired with an HSA. The budget can fund HSA contributions for employees who enroll, using funds set aside for a richer plan tier that few people chose. The total budget stays the same; only its mix changes. Wellness support can also be funded from that pool, including initiatives related to building a mentally healthier workplace.
Why Tax Rules Make This Work
These rules apply to US employers only. According to IRS Publication 969, employer payments for employees' accident or health insurance, including coverage for spouses and dependents, are generally not treated as wages and are not subject to Social Security, Medicare, FUTA, or federal income-tax withholding. Employer HSA contributions are generally excluded from employee income, and businesses may deduct them for the year they are made. Check eligibility and nondiscrimination requirements before estimating the after-tax cost.
The employee benefit depends on where the money goes:
- Lower out-of-pocket costs: HSA contributions can help offset the deductible for employees who enroll.
- Clearer choices: A budget that follows employee selections makes it easier to show what each option receives.
- Better fit by life stage: A new parent and a healthy 26-year-old may value different coverage, rather than being pushed into the same tier.
Ask employees what they value before setting the mix. An employee benefits survey template can help gather that input. Then set an approval threshold for moving funds between options and keep the total budget as a fixed guardrail. Which choices could your current budget fund if its allocation followed enrollment?
When Flexible Budgets Backfire and Guardrails to Set
More flexibility is not automatically better. That's the uncomfortable truth most explainers skip.
Research on medium-sized manufacturers in Mwanza, Tanzania found that activity-based budgeting, participatory budgeting, and rolling forecasts were each positively associated with financial performance, and together the model explained 64.8% of performance variation, according to the IJEBMR study of Mwanza manufacturers. Participatory budgeting improved ownership, rolling forecasts improved adaptability, and activity-based budgeting strengthened cost control. Notice the pattern. The wins came from governance and ownership, not from flexibility alone.
The Behavioral Risk
Budgets shape behavior through commitment. A personal-finance study found that optimistic budgets were associated with lower spending, and the effect persisted for six months even though spending stayed above budget, as reported in the Journal of Consumer Research study on optimistic budgets. Replace firm targets with endlessly adjustable ones and you can weaken that commitment. Teams learn they can reset the target after a poor quarter, and overruns get rationalized instead of fixed.
The Three Layer Fix
- Fixed strategic envelope: Compliance, reserves, and agreed investments don't flex.
- Flexible cost drivers: Enrollment, recruiting, and payroll-linked fees scale with activity.
- Rolling variance review: Money moves only when predefined thresholds are crossed.
Set those thresholds in writing before you start.
- Trigger: A variance above an agreed percentage forces a review.
- Ownership: One named owner per line item, accountable for the rate.
- Approval: Written sign-off required above a set dollar amount.
Don't flex a line just because it's over budget. Flex it only when the driver you agreed on in advance, such as enrolled headcount, actually moved.
Benefits Budget KPIs to Track Each Quarter
Six KPIs help show whether a flexible benefits budget is tracking real activity and staying within its guardrails. Read them together: one figure can look healthy while another reveals a problem.
| KPI | How to calculate | Example value | What it signals |
|---|---|---|---|
| Cost per enrolled employee | Total benefits spend / enrolled employees | $825 | Unit-rate control |
| Flexed budget variance % | (Actual – flexed budget) / flexed budget | 3.1% ($3,000 / $96,000) | Efficiency apart from volume |
| Enrollment rate | Enrolled employees / eligible employees | 120 / 140 = 85.7% | Whether the budget reflects actual participation |
| Benefits cost as % of payroll | Total benefits cost / eligible payroll | 14.8% (vs. 15.2% prior quarter) | Cost burden and benchmarking |
| Forecast headcount accuracy | 1 – (abs(forecast – actual) / actual) | 1 – (20 / 120) = 83.3% | Quality of planning inputs |
| Days to close enrollment | Close date minus launch date | 21 days (down from 35) | Operational speed |
Reading Them Together
Start with cost per enrolled employee, the unit cost of providing benefits to someone who joined. Then compare the flexed budget variance % with the flexed budget, so a change in headcount does not get mistaken for a change in spending efficiency. For example, enrollment can rise while unit cost remains steady. That points to volume growth, not necessarily overspending.
The enrollment rate adds context: if 120 of 140 eligible employees enroll, the rate is 85.7%. A budget based on all eligible employees may overstate costs when fewer participate. The benefits cost as % of payroll shows whether benefits are taking a larger share of payroll over time, while forecast headcount accuracy indicates whether planning assumptions matched actual headcount.
Finally, days to close enrollment tracks how long the process takes. A shorter close time can indicate faster operations, but it should not be treated as success if the enrollment data is incomplete. Pair the KPI with clear ownership and approval rules, so speed does not become a reason to bypass checks.
Fix the Data First
KPIs are only as reliable as their inputs. In 2025, 49% of middle-market CFOs surveyed by Cherry Bekaert said poor data quality blocked critical financial decisions, while 39% expressed concern about forecasting accuracy, according to the Cherry Bekaert CFO survey. The survey also pointed to rolling forecasts and scenario-based planning as responses.
Reconcile enrollment counts against payroll before reviewing variances. Check the first three KPIs monthly, then review the remaining measures quarterly. Keep each measure tied to an owner and a fixed definition. If a KPI changes only because someone adjusted the budget, it reflects that edit, not underlying performance.
How to Set Up Flexible Budgeting in a Benefits Platform
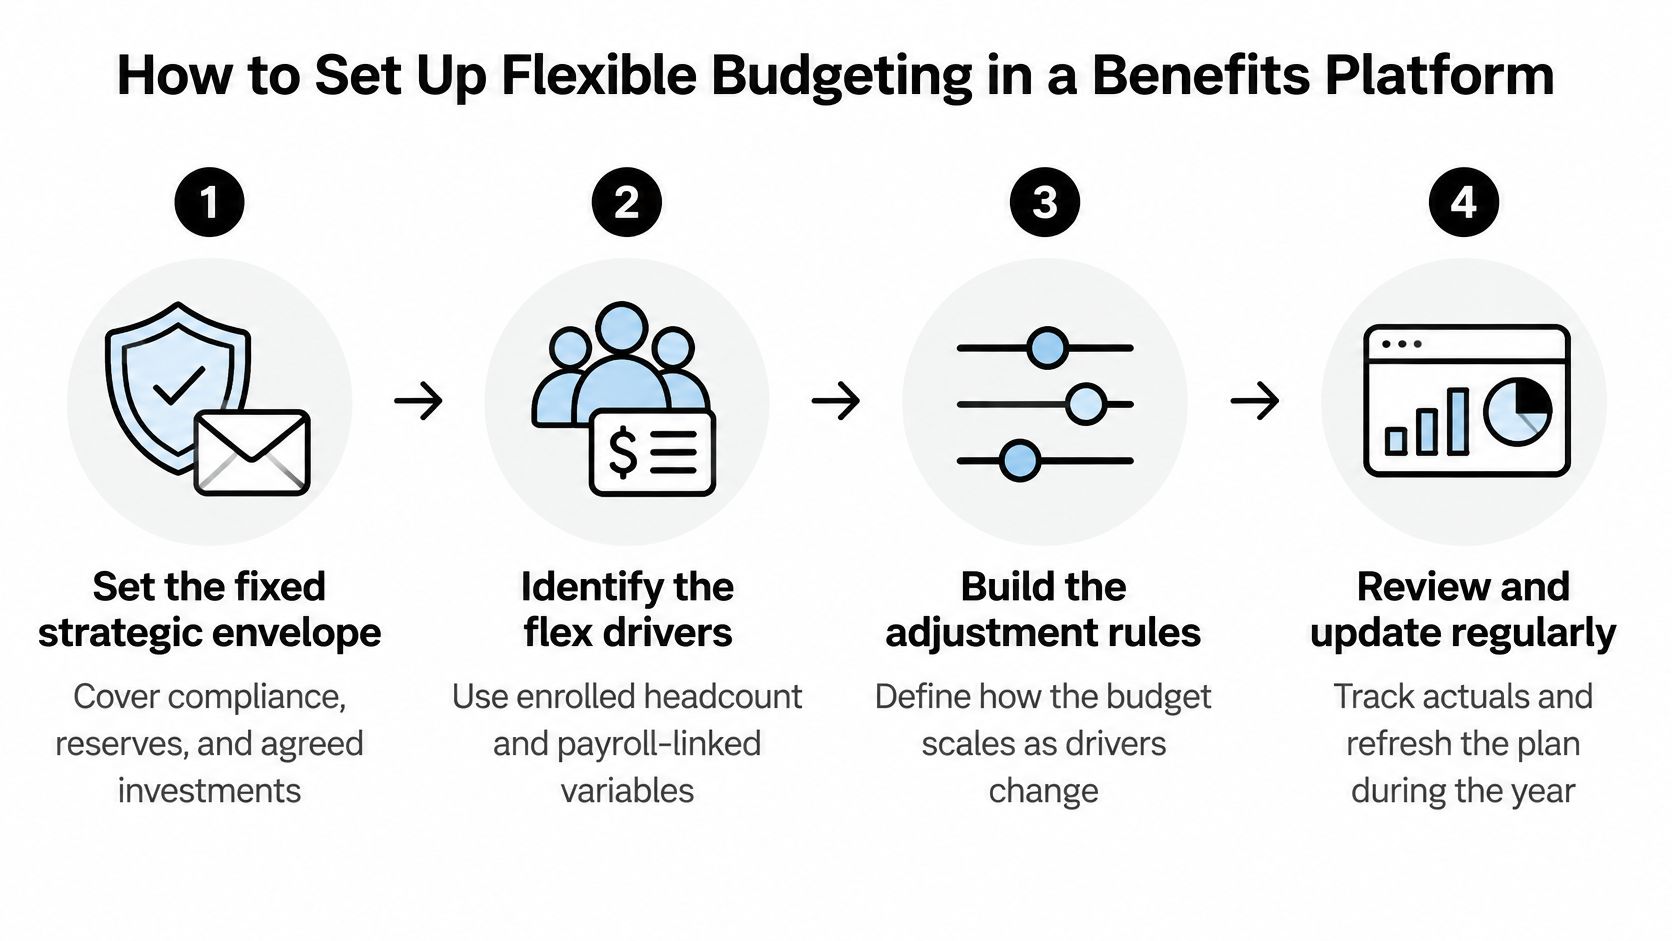
Setup takes six steps. Each one exists for a specific reason, and skipping the early ones makes the later ones unreliable.
The Six Steps
- Set the fixed strategic envelope. Lock in compliance, reserves, and agreed investments first. This is the money that never flexes, no matter what headcount does.
- Identify the flex drivers. Enrolled headcount, payroll-linked services, and recruiting usually qualify. The driver must be something you can measure from your systems every month.
- Set a per-employee rate for each driver. Base it on last year's actual cost, adjusted for known renewals. That rate becomes a target procurement and HR can be judged against.
- Define thresholds and name one owner per line. Decide in advance how big a variance triggers reallocation, and who approves it. Without this step, flexibility becomes a way to explain away overruns.
- Connect the budget to a five-year projection. The U.S. Small Business Administration recommends that financial projections cover five years and include projected income statements, balance sheets, cash-flow statements, and capital-expenditure budgets, per the SBA business planning guidance. Tying benefit scenarios into that five-year view shows how today's contribution choices hit future cash flow, not just this quarter's expense line.
- Run a monthly variance review. Use the KPIs from the previous section, in the same order, every month. Consistency is what turns a spreadsheet into a control system.
Where a Platform Helps
Steps 2, 3, and 6 live or die on accurate headcount, which is the most common source of error. Benely lets teams compare more than 4,000 health plans from carriers such as Aetna, Kaiser, Anthem, Blue Shield, and UnitedHealthcare, set budgets, automate enrollments, and track open enrollment progress. Its employee benefits management platform connects payroll data, so enrolled headcount stays current without manual reconciliation. Carrier availability varies by region, so confirm options for your locations.
Two Pitfalls and Fixes
- Enrollment data out of sync with payroll: Reconcile both files before every review. Don't flex a budget on stale counts.
- Rates applied to terminated employees: Run a monthly headcount cutoff so departed staff drop out of the driver before you calculate.
Reconciliation rule: If enrollment and payroll disagree, fix the counts first. The variance conversation can wait one day. A decision built on wrong headcount can't be unmade.
Confirm Your Flex Rules Before the Next Enrollment
Adopt flexible budgeting this cycle, but only for volume-driven lines, meaning enrollment-linked costs, payroll-linked services, and recruiting. Keep compliance, reserves, and strategic commitments on fixed guardrails.
Flexing pays off when headcount or enrollment moves by more than a few percent in a quarter. If yours barely moves, a static budget with a quarterly review is enough. Don't add process you don't need.
One condition matters most. If nobody owns a line item, name an owner before you adopt flexibility, because ownerless flexibility makes overruns easy to explain away.
So do this one thing before the next open enrollment. Rebuild the budget with per-employee rates, confirm each owner and threshold, and test the model against last quarter's actuals. The flexed variance should come out small and explainable. If it doesn't, the cause is usually headcount data or rate inputs, not the method, so reconcile enrollment counts to payroll first. A benefits program review can benchmark your current spend and show which lines a flexible budget would change.
Put those flex rules into practice before your next enrollment window opens. Benely helps you set a benefits budget, compare more than 4,000 health plans from carriers such as Aetna, Kaiser, Anthem, Blue Shield, and UnitedHealthcare, and track enrollment against connected payroll so your per-employee rates stay accurate. Visit today to benchmark your current spend and see which lines a flexible budget would change.